
For value investors the goal is to find assets priced below their intrinsic value, providing a margin of safety and potential for significant future growth. Could applying this principle to DeFi help identify underappreciated projects that are gaining significant traction. Let’s find out…
Market Cap, TVL & FDV
Market capitalization is the total value of a cryptocurrency or token in circulation. It is calculated by multiplying the current price of the token by the number of tokens currently circulating. It provides an indication of the size and value of a project at a given time but does not account for future token issuance.
Total Value Locked or TVL refers to the total amount of assets (e.g., cryptocurrencies or stablecoins) locked in a DeFi protocol. It reflects the amount of capital that users have staked, lent, or provided as liquidity on the platform. Higher TVL suggests a protocol’s popularity and trust among users, as well as its level of activity and utility.
Fully Diluted Valuation or FDV represents the total potential value of a cryptocurrency if all of its tokens were in circulation. It is calculated by multiplying the current price of the token by the total maximum supply (including tokens yet to be issued). FDV provides a broader view of a project’s long-term valuation, factoring in future token distribution or inflation.
There is a significant issue with low market cap, high FDV coins in DeFi which are ticking time bombs for VC selling pressure and underperformance. There are also a lot of projects which just aren’t gaining traction and investment in their actual products which can be measured in TVL. By comparing the ratios of these metrics we can hope to find some gems and work out a base line from which we can assess new projects.
The MKTCAP/FDV ratio outlines how much of the total supply of tokens is currently circulating. A ratio of 0.5 means that half the coins are still locked up in vesting schedules or some other mechanism which is keeping them off the market.
The TVL/FDV ratio compares a protocol’s fully diluted valuation to the amount of capital actually locked into its system. The idea is to identify whether a project is overvalued or undervalued relative to the utility it provides. A high ratio suggests the project is undervalued and a lower ratio may suggest it’s overvalued.
Note there are a lot of nuances here and crypto prices tend to follow narratives rather than fundamentals anyway so don’t use this for investment decisions.
The Value Investing DeFi List
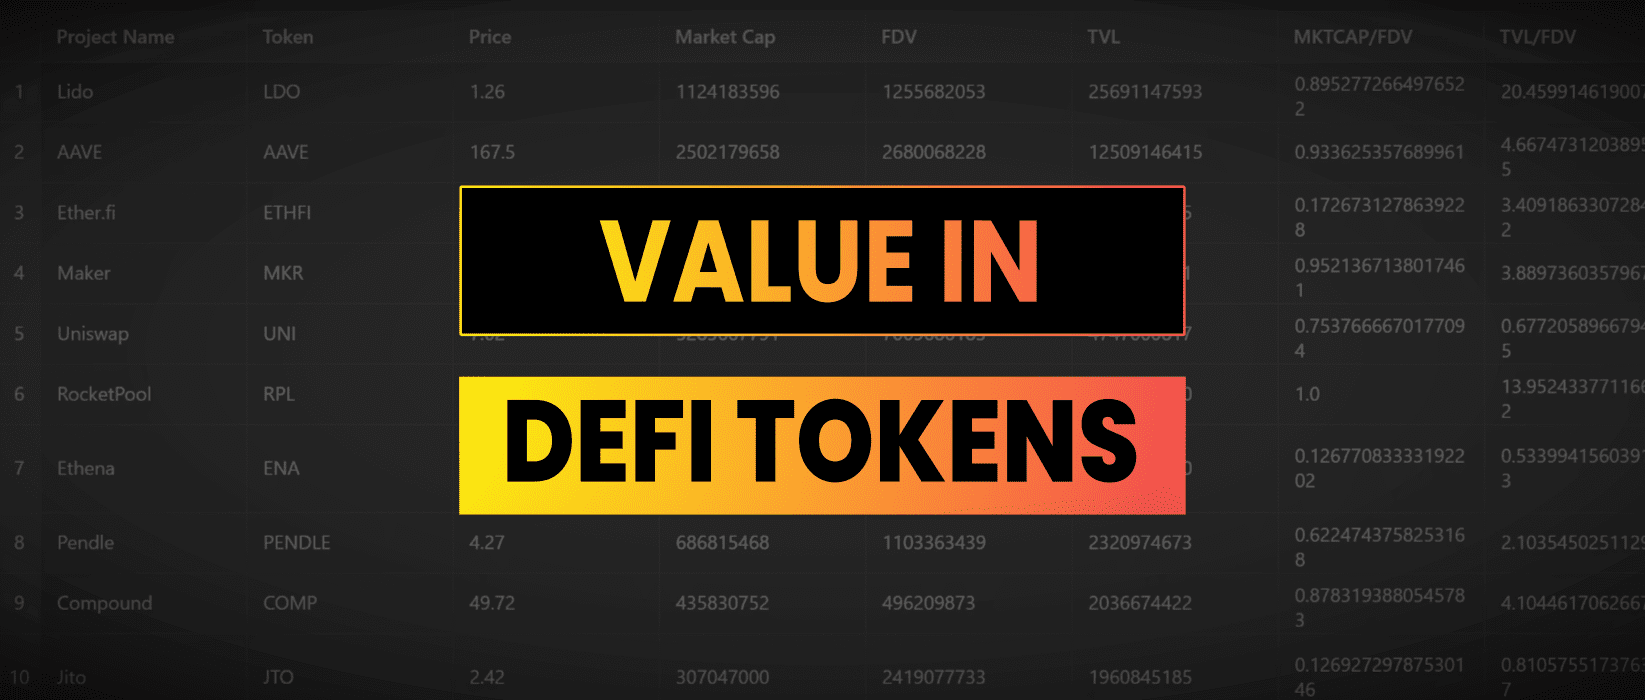
Let’s put this into practice and look at some DeFi projects ranked by TVL and see how they compare. Sources are Defillama & Coingecko
| Project | Token | Price | Market Cap | FDV | TVL | MKTCAP/FDV | TVL/FDV |
|---|---|---|---|---|---|---|---|
| Lido | LDO | $1.2600 | $1,124,183,596 | $1,255,682,053 | $25,691,147,593 | 0.90 | 20.46 |
| AAVE | AAVE | $167.5000 | $2,502,179,658 | $2,680,068,228 | $12,509,146,415 | 0.93 | 4.67 |
| Ether.fi | ETHFI | $1.5400 | $266,072,481 | $1,540,902,654 | $5,253,224,265 | 0.17 | 3.41 |
| Maker | MKR | $1,580.8100 | $1,391,311,425 | $1,461,251,735 | $5,683,883,531 | 0.95 | 3.89 |
| Uniswap | UNI | $7.0200 | $5,283,667,791 | $7,009,686,183 | $4,747,000,817 | 0.75 | 0.68 |
| RocketPool | RPL | $11.3300 | $235,312,201 | $235,312,201 | $3,283,177,900 | 1.00 | 13.95 |
| Ethena | ENA | $0.3201 | $608,188,010 | $4,797,538,945 | $2,561,857,760 | 0.13 | 0.53 |
| Pendle | PENDLE | $4.2700 | $686,815,468 | $1,103,363,439 | $2,320,974,673 | 0.62 | 2.10 |
| Compound | COMP | $49.7200 | $435,830,752 | $496,209,873 | $2,036,674,422 | 0.88 | 4.10 |
| Jito | JTO | $2.4200 | $307,047,000 | $2,419,077,733 | $1,960,845,185 | 0.13 | 0.81 |
| Curve | CRV | $0.3107 | $372,598,841 | $675,295,158 | $1,939,699,325 | 0.55 | 2.87 |
| Venus | XVS | $7.6000 | $124,495,573 | $226,094,905 | $1,837,334,413 | 0.55 | 8.13 |
| PancakeSwap | CAKE | $2.0700 | $560,575,648 | $791,701,806 | $1,760,877,045 | 0.71 | 2.22 |
| Kamino | KMNO | $0.0650 | $87,928,166 | $651,319,751 | $1,535,937,424 | 0.13 | 2.36 |
Data collected on the 26th September 2024 during a “shopping spree” period in crypto markets.
It will be interesting to come back to this in 5-10 years time and see how much the MKTCAP/FDV and TVL/FDV metrics influenced the success and token appreciation of different projects.
Here are the averages (note this just includes large cap projects with >$1B in TVL):
- Mean Average MKTCAP/FDV = 0.60
- Mean Average TVL/FDV = 5.01
The two projects that really stand out are LIDO finance which is the creator of stETH (staked Ethereum liquid staking token) and Rocket Pool (creator of rETH liquid staking token). Liquid staking tokens have seen a lot of adoption and the value accrual to token holders in the DAO/projects is yet to be realised.
To take this further it would be interesting to add the metrics to a screener so projects could be sorted by these metrics and new tokens could be assessed quickly relative to peers.
