In this Pinescript tutorial we will build out a simple TradingView indicator using the latest version of Pinescript.
- TradingView Indicator Tutorial 🎥
- Getting Started With Indicators
- Pinescript Basic Indicator
- Pinescript 5 Updates
- Custom Bitcoin Indicator
- Adding Labels & Alerts
- Popular Tradingview Indicators
https://www.tradingview.com/pricing/?share_your_love=jimbachini
TradingView Indicator Tutorial
This video goes through the Tradingview indicator tutorial with more details and code snippets available in the article below.

Getting Started With Indicators
TradingView indicators are used to assess markets by adding additional data to charts. Users can create their own indicators using code called Pinescript which is native to Tradingview.
Pinescript is unique in that it runs over and over again on every candle reiterating and constantly plotting points across time series data. So a chart might have 300 candles which means the code will execute 300 times to render the indicator.
Let’s look at a simple example.
Pinescript Basic Indicator
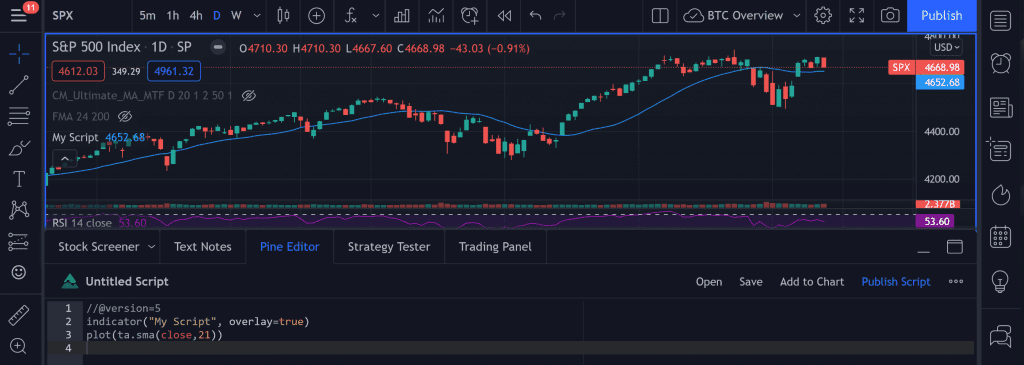
//@version=5
indicator("My Script", overlay=true)
plot(ta.sma(close,21))
The first line declares that we are using the latest Pinescript 5 code. The second line gives the script a name and states that the indicator should be overlayed on top of the existing chart. Finally line 3 plots the SMA (Simple moving average) of the last 21 close prices.
On a chart this draws the blue moving average line we see here following the SP500 price data.

To execute this code in your TradingView terminal click on the “Pine Editor” tab at the bottom of the page, paste the code in and then click “Add to Chart” on the top right side of the editor.
There’s your first real Pinescript 5 Tradingview Indicator live on any chart you pull up. Note that the indicator will change if you change the market or the timeframe. So in the chart above we are looking at a 21 day SMA, if we change this to a 1 hour chart the indicator will update to show the 21 hour SMA.
Pinescript 5 Updates
Pinescript v5 was released in 2021 and has brought in some welcome improvements. The most notable change is the addition of namespacing which organises internal functions and helps categorise the documentation.
If you have old v4 code you can update it by pasting it in to the Pine Editor and clicking on the 3 dots menu next to Publish Script and then select “Convert to v5”.
Another great addition in v5 is the implementation of libraries which allows commonly used code snippets to be reused across multiple indicators and strategies.
There’s a list of user contributed free to use libraries here:
https://www.tradingview.com/scripts/?script_type=libraries
We can import libraries like this:
import PineCoders/AllTimeHighLow/1 as athFrom there we can use the ath namespace to access the libraries exported functions. The structure for the import is $Username/$Library/$Version
Custom Bitcoin Indicator
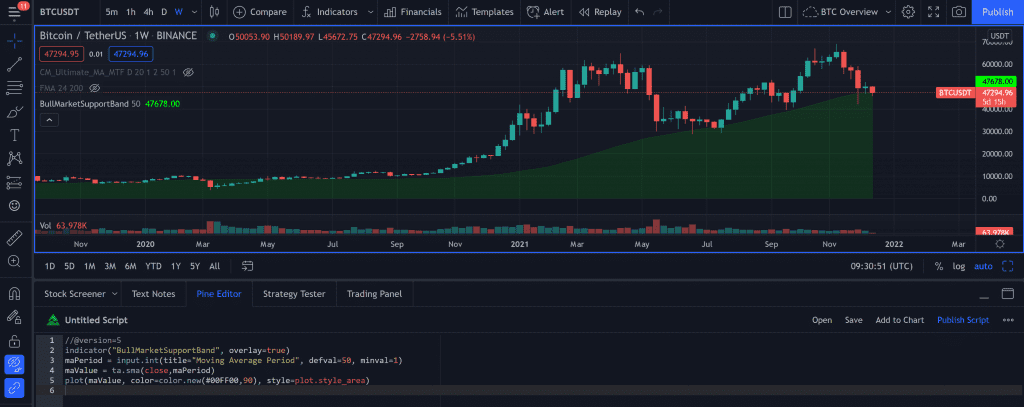
Let’s create a custom Tradingview indicator for Bitcoin using the infamous “Bitcoin Bull Market Support Band” which is actually just the 50 week SMA.
//@version=5
indicator("BullMarketSupportBand", overlay=true)
maPeriod = input.int(title="Moving Average Period", defval=50, minval=1)
maValue = ta.sma(close,maPeriod)
plot(maValue, color=color.new(#00FF00,90), style=plot.style_area)
Notice on line 3 we have an input function which allows the user to go in to the indicator settings and adjust the value.
On the final line we are adding a custom colour in RGB hex format similar to CSS with a transparency of 90. The style for this is set to area rather than just a line giving a bright green support area.

Now lets highlight the areas where the market crossed into this support band with labels and add real time alerts to make it more useful.
Adding Labels & Alerts
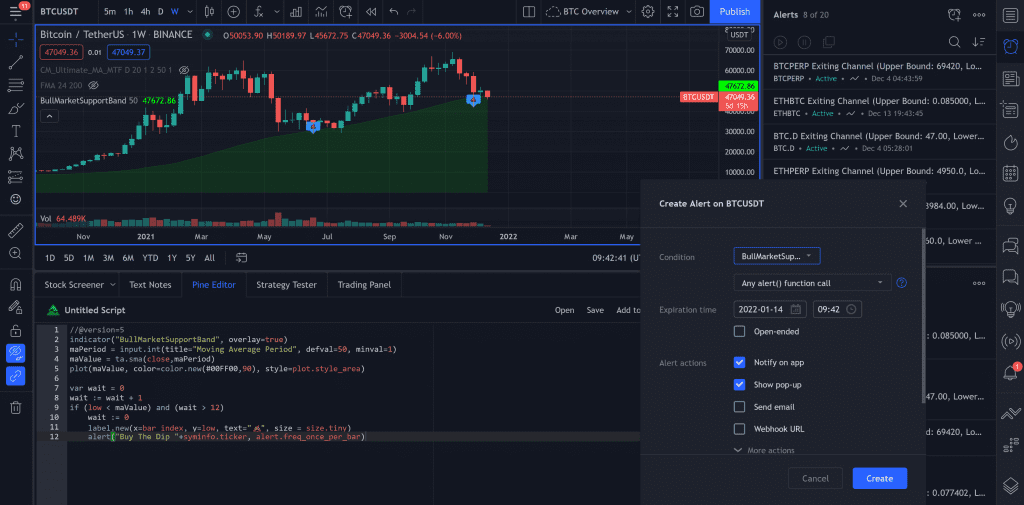
There’s quite a lot going on in the code below but it serves as a good demonstration piece for better understanding some important Pinescript concepts.
First we are going to define a global variable called wait and give it a value of 0. A global variable is different to a normal variable because it is stored across multiple bars so we can track running data.
On each bar we are going to increment this value by 1. Note that we use := instead of just = to adjust the global variable.
var wait = 0
wait := wait + 1
if (low < maValue) and (wait > 12)
    wait := 0
    label.new(x=bar_index, y=low, text="💩", size = size.tiny)
    alert("Buy The Dip "+syminfo.ticker, alert.freq_once_per_bar)
On line 3 we have a if statement which has two parts if the low of the current bar is below the moving average and if wait is greater than 12. The reason we have this wait function in there is so we don’t get constant alerts every day. It can only go off once every quarter to let us know the first time Bitcoin drops below long term support.
If both satements are true we move on to the indented code. Indented code in Pinescript needs to be 4 spaces, don’t blame me. We start by resetting wait to zero then we add a label and an alert.
The label is set to the current bar on the x axis, low which will show below the bar on the y axis. We could have used any text and in my maturity of creating financial technology content I decided a poop emoji would be most suitable. Finally set the size of the label to tiny.
For the alert we set the text to “Buy The Dip BTCUSDT” the ticker will be added dynamically using the syminfo.ticker native variable. We then set the frequency to once per bar which will execute in real time as soon as the price drops below the level and then not again.
Alerts in Pinescript create the option for an alert rather than an alert itself so once the code is added to the chart we can go into the Alerts tab and click the add icon which looks a bit like an alarm clock with a plus sign. Then change the Condition to the name of our indicator “BullMarketSupportBand” and confirm.
If you have the mobile app installed you can setup notifications to both desktop and the mobile app.

Popular Tradingview Indicators
This is one example of an indicator which uses a simple moving average. Let’s look at some others and how they can be used.
- ta.ema – Exponential moving average – Provides a faster reacting curve by weighting new price movements higher. Used a lot by market makers and quants.
- ta.rsi – Relative strength index – provides a number between 0-100, below 20 is over sold, above 80 is over bought.
- ta.vwap – Volume weighted average price – average price by traded volume. Used a lot by OTC desks and larger market participants to guarantee fair pricing.
- ta.atr – Average true range – provides the average from candle high to low which is useful when calculating volatility and trade exits.
- ta.macd – Moving average convergence divergence – Shows changes in strength and momentum of a trend as a slow moving average and fast moving average get closer or further apart.
The truth is that even the most complex of indicators in TradingView are built on lagging price and volume data. There is no magic indicator or strategy that will make you rich over night. Indicators do serve a purpose however and they can be used to understand and interpret the markets better.
TradingView is the leading charting platform and it’s native Pinescript language is a great addition to any traders tool chest.
If you would like to learn more visit: TradingView v5
I also have an older article detailing strategy creation and backtesting using Pinescript:
Pine Script Tutorial | How To Develop Real Trading Strategies On TradingView


