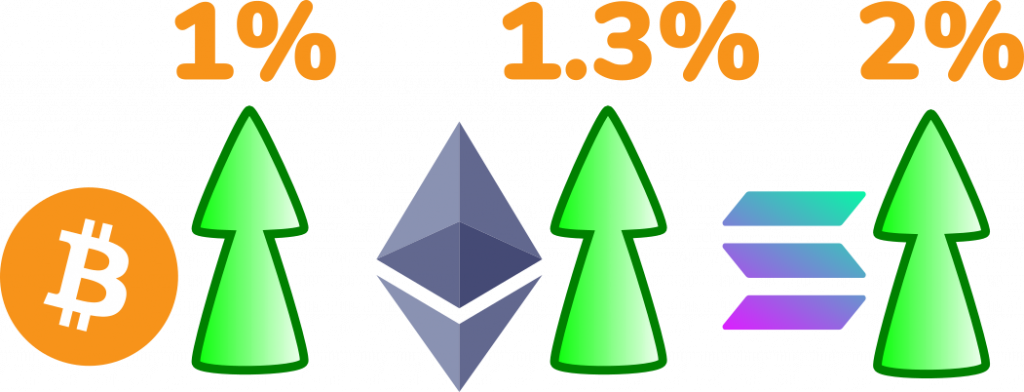
In this study we are looking at crypto market volatility and how different altcoins markets move relative to Bitcoin. For example if Bitcoin moves up or down 1% Solana will roughly move double that amount for various reasons discussed below.
Crypto Market Volatility List
| FTX Market | Beta | Volume |
|---|---|---|
| BTC-PERP | 1.01 | $4609m |
| ETH-PERP | 1.29 | $4471m |
| SOL-PERP | 1.98 | $948m |
| ETH/USD | 1.29 | $781m |
| BTC/USD | 1 | $687m |
| AVAX-PERP | 2.38 | $527m |
| DOGE-PERP | 1.79 | $382m |
| MATIC-PERP | 2.07 | $368m |
| LUNA-PERP | 2.39 | $348m |
| SOL/USD | 1.96 | $326m |
| NEAR-PERP | 2.53 | $255m |
| BTC/USDT | 0.99 | $192m |
| SAND-PERP | 3.45 | $182m |
| DOT-PERP | 1.87 | $171m |
| USDT/USD | 0.01 | $167m |
| ADA-PERP | 1.4 | $163m |
| BNB-PERP | 1.34 | $152m |
| ETH/USDT | 1.27 | $143m |
| XRP-PERP | 1.41 | $138m |
| BTC-1231 | 1.06 | $133m |
| EOS-PERP | 1.6 | $131m |
| LINK-PERP | 1.78 | $119m |
| BTC-0325 | 1.08 | $95m |
| LTC-PERP | 1.6 | $91m |
| ATOM-PERP | 2.17 | $84m |
| GALA-PERP | 4.66 | $83m |
| ETH-1231 | 1.35 | $76m |
| ETH-0325 | 1.39 | $76m |
| SUSHI-PERP | 1.99 | $73m |
| MANA-PERP | 3.79 | $73m |
| FTM-PERP | 2.68 | $72m |
| CRV-PERP | 2.65 | $67m |
| EGLD-PERP | 2.16 | $64m |
| FTT-PERP | 1.47 | $62m |
| BCH-PERP | 1.23 | $62m |
| MATIC/USD | 2.07 | $61m |
| AXS-PERP | 2.16 | $58m |
| BNB/USD | 1.32 | $57m |
| DOGE/USD | 1.78 | $54m |
| SPELL-PERP | 4.12 | $49m |
| XTZ-PERP | 2.22 | $43m |
| FTT/USD | 1.44 | $43m |
| FIL-PERP | 1.63 | $39m |
| CRO-PERP | 2.38 | $37m |
| SOL/USDT | 1.94 | $34m |
| XRP/USD | 1.41 | $33m |
| AVAX/USD | 2.6 | $33m |
| ALGO-PERP | 2 | $31m |
| XLM-PERP | 1.56 | $27m |
| GRT-PERP | 2.13 | $26m |
| CAKE-PERP | 1.52 | $26m |
| DYDX-PERP | 2.72 | $25m |
| SHIB-PERP | 3.57 | $25m |
| SRM-PERP | 1.79 | $24m |
| OKB-PERP | 2.16 | $24m |
| LTC/USD | 1.61 | $23m |
| LRC-PERP | 3.43 | $22m |
| BNB/USDT | 1.31 | $21m |
| USDT-PERP | 0.01 | $21m |
| SLP-PERP | 2.81 | $19m |
| ALT-PERP | 1.22 | $19m |
| WAVES-PERP | 1.61 | $19m |
| AR-PERP | 2.83 | $18m |
| ENJ-PERP | 2.59 | $18m |
| VET-PERP | 1.9 | $18m |
| ICP-PERP | 1.97 | $18m |
| LINK/USDT | 1.75 | $17m |
| SAND/USD | 3.55 | $17m |
| 1INCH-PERP | 2.24 | $17m |
| BTT-PERP | 1.68 | $17m |
| RAMP-PERP | 2.39 | $16m |
| BAT-PERP | 2.55 | $16m |
| UNI-PERP | 1.6 | $16m |
| LINK/USD | 1.77 | $15m |
| ENS-PERP | 4.43 | $15m |
| AAVE-PERP | 1.6 | $15m |
| OMG-PERP | 2.51 | $15m |
| SUSHI/USD | 1.98 | $15m |
| RUNE-PERP | 2.51 | $14m |
| ONE-PERP | 2.79 | $14m |
| CLV-PERP | 2.32 | $14m |
| ALICE-PERP | 2.9 | $14m |
| STX-PERP | 2.41 | $12m |
| BSV-PERP | 1.49 | $12m |
| ETC-PERP | 1.4 | $12m |
| SPELL/USD | 4.37 | $12m |
| COMP-PERP | 1.72 | $12m |
| SRM/USD | 1.75 | $12m |
| TRX-PERP | 1.24 | $11m |
| DOGE/USDT | 1.73 | $11m |
| RAY/USD | 1.73 | $11m |
| FLOW-PERP | 1.76 | $11m |
| BCH/USD | 1.24 | $11m |
| RSR-PERP | 2.26 | $10m |
| KSHIB-PERP | 3.2 | $10m |
| HNT-PERP | 2.32 | $10m |
| THETA-PERP | 1.96 | $10m |
| SOL-1231 | 1.95 | $9m |
| ATLAS-PERP | 2.67 | $9m |
| FTM/USD | 2.75 | $9m |
| MANA/USD | 3.82 | $9m |
| HBAR-PERP | 2.02 | $9m |
| STORJ-PERP | 2.72 | $8m |
Code & Methodology
The code I wrote for this was part of a larger system trading platform but I can publish the module used to calculate these betas.
setBetas: () => {
  const btcRangePercentages = [];
  db.mkts['BTC/USD'].day.forEach((candle) => {
    btcRangePercentages.push((candle.h - candle.l) / candle.o * 100);
  });
  Object.keys(db.mkts).forEach(async (name) => {
    const rangePercentages = [];
    db.mkts[name].day.forEach((candle) => {
      rangePercentages.push((candle.h - candle.l) / candle.o * 100);
    });
    const percentageDiffToBTCs = []
    for (let i = 0; i < Math.min(rangePercentages.length, 90); i++) { // last 90 days
      const btcRange = btcRangePercentages[btcRangePercentages.length - i - 1];
      const altRange = rangePercentages[rangePercentages.length- i - 1];
      const diff = ((altRange - btcRange) / btcRange) + 1;
      percentageDiffToBTCs.push(diff);
    }
    const beta = utils.round(utils.calculateSMA(percentageDiffToBTCs),2);
    console.log(`${name} ${beta} ${volume}`);
  });
},
The data was provided by FTX’s excellent API to get daily price candles for the last 90 days.
I am calculating the range for the day by taking the daily low from the daily high and then dividing this by the open to get range percentage of the opening price.
Then the range is compared to Bitcoin on each day using the formula ((altRange – btcRange) / btcRange) + 1;
We then just take an average of those results to get a value which can be used as a beta relative to market movements (Bitcoin). Note that this doesn’t take into account the correlation between the assets and BTC could go up and ETH down and it would not differentiate if the percentages are the same.

You could potentially shorten this range and assess changes in beta as assets start to move. Might make for a good website/page.
Reasoning & Alpha
The point of this is to highlight altcoins that are moving quickly and stand to gain the most if we have a market upturn or even alt season.
Lower liquidity assets tend to move faster because it takes less buying and selling relative to the amount of liquidity on exchange to move the price. It can
Ideally an investor would want to be holding highly volatile assets when markets are going up and low volatility assets when markets are going down.
Volatility is a double edged sword but it’s something that needs to be addressed and managed for investors looking to outperform the market.
Let’s dive in and compare the alternative layer1’s
- 1.98 Solana
- 2.38 Avax
- 2.07 Matic
- 2.39 Luna
- 1.34 BNB
- 2.68 FTM
We can see that volatility is considerably lower on BNB which may be due to is place as an exchange token rather than just an alt L1 with Binance Smart Chain. FTM has the highest beta, it also has the lowest trading volume. For me Luna combines a high beta with good volume and strong fundamentals, something I’ll be looking at further.
Some other noteworthy markets (certainly not recommendations) are:
- 4.43 ENS – may potentially be caused by recent launch and listing which is often a period of peak volatility.
- 3.45 SAND – the sandbox benefited from the metaverse narrative, MANA too.
- 4.12 SPELL – down more than 50% from a peak in November.
- 3.57 SHIB – and you thought DOGE was volatile.
- 1.23 BCH – lower beta than ETH (1.3) which surprised me.
Obviously these stats don’t make an investment thesis on their own but they add another data point to take into consideration when going risk-on.
Video Discussion


