Expected value or EV is a term used in finance and gambling to define the estimated return of a given situation based on enough iterations.

For example if you bet $1 on a coin toss your EV would be 0 because you would win/lose 50% of the time and your loss would be $1 and your win potential would be $1 ($2 including your original stake).
So in this simple example let’s look at how we would calculate EV.
All Possible Outcome Valuation
In the coin toss example there are two outcomes, heads or tails, each has a 50% chance of occurring each time the bet is placed and the coin is tossed.
Unless you are calculating critical scenarios then I would suggest ignoring fringe events such as the coin landing on it’s side with minimal chance of occurrence.
| All Possible Events | Outcome | Frequency | Valuation |
| Heads (Lose) | -$1 | 50% | -$0.5 |
| Tails (Win) | +$1 | 50% | +$0.5 |
| EV | $0 |
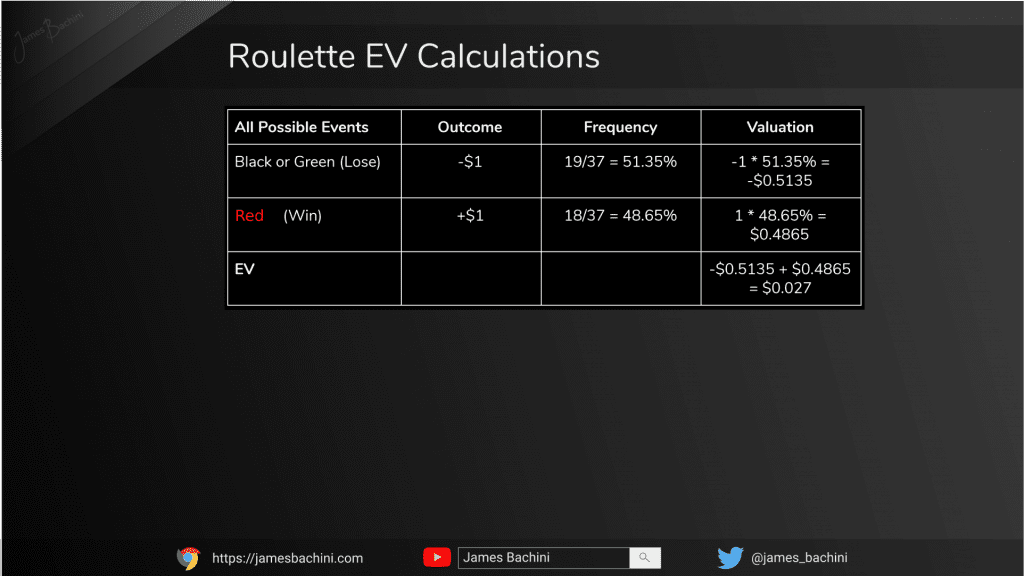
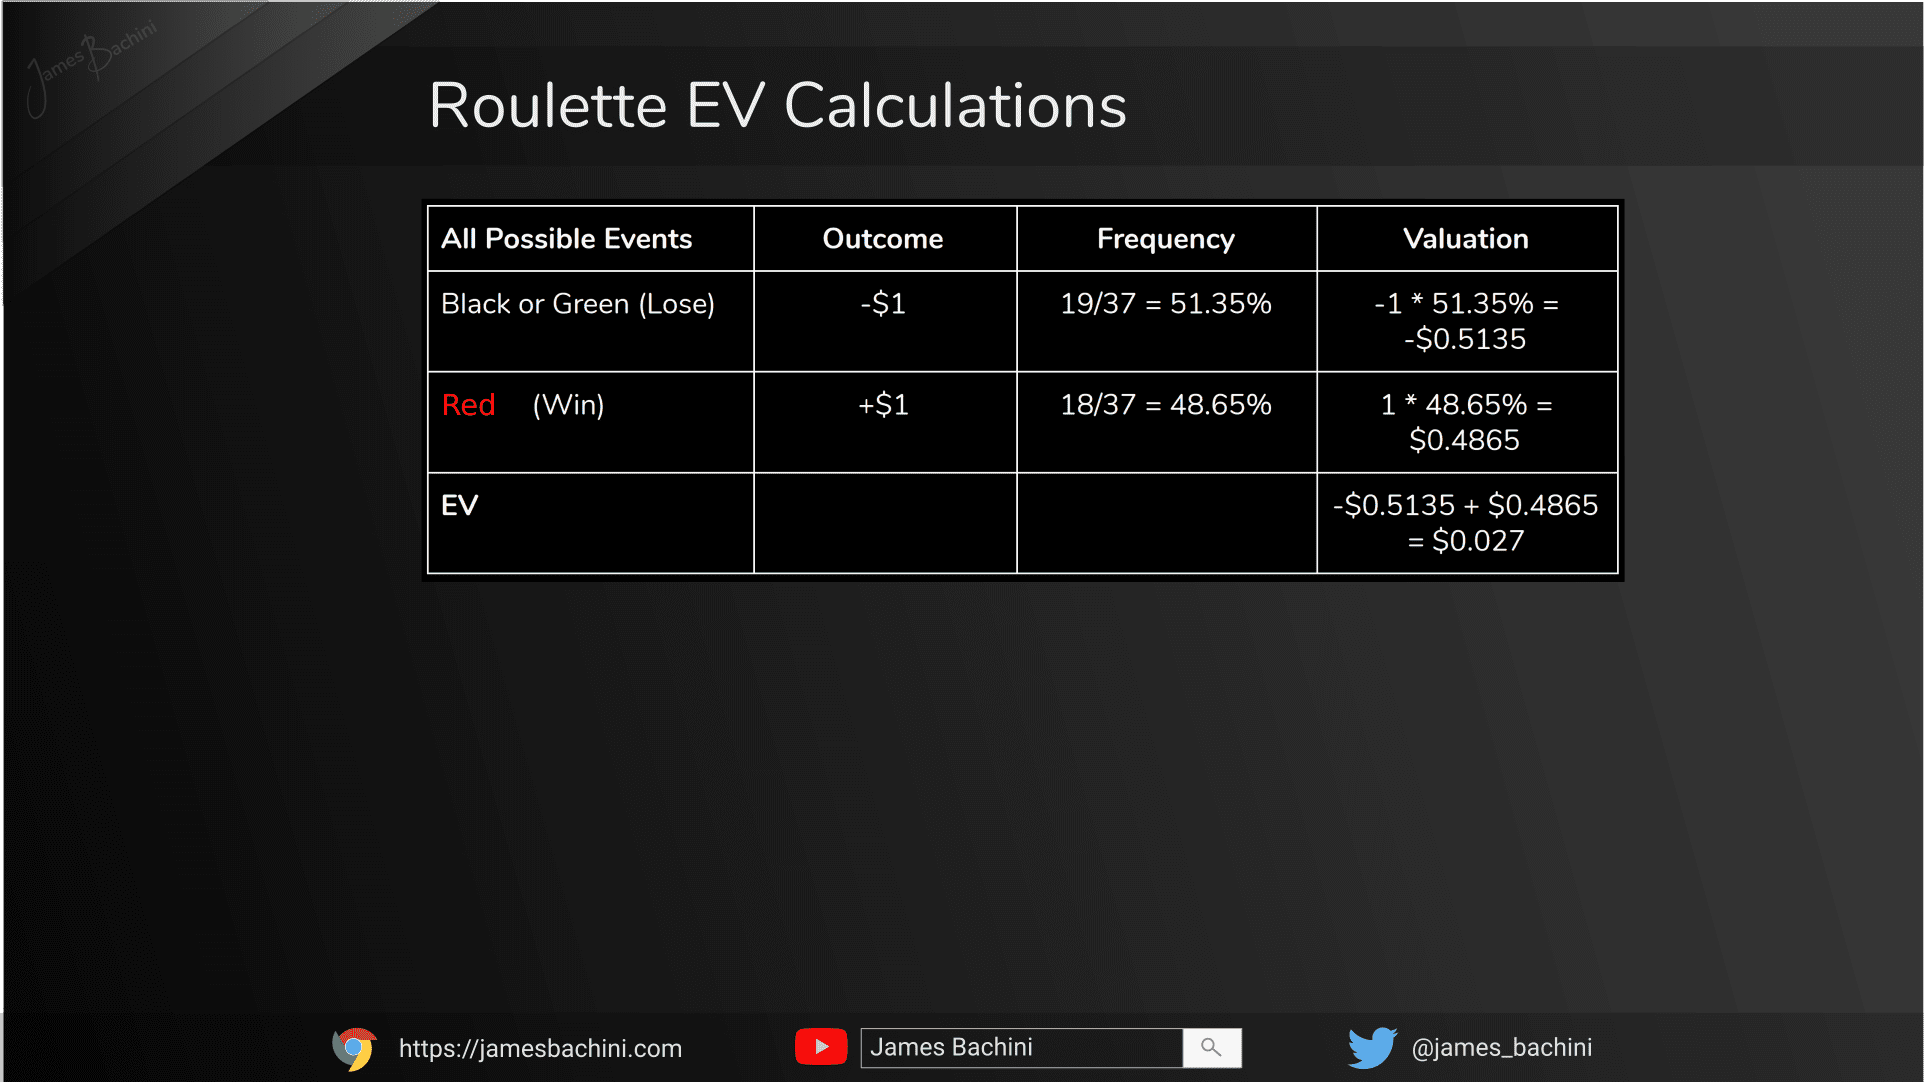
Now let’s look at a slightly more complex gambling example from the game of roulette. On a European roulette wheel there are 18 red numbers, 18 black numbers and a green “0” giving a total of 37 numbers. Bets placed on red or black are paid out at 1:1 similar to the coin toss.

| All Possible Events | Outcome | Frequency | Valuation |
| Black or Green (Lose) | -$1 | 19/37 = 51.35% | -1 * 51.35% = -$0.5135 |
| Red (Win) | +$1 | 18/37 = 48.65% | 1 * 48.65% = $0.4865 |
| EV | -$0.5135 + $0.4865= $0.027 |
So each time you spin a roulette wheel you expect to lose 2.7% of your equity staked. Or if you are a casino your house edge is 2.7%.
Let’s do this exercise once more for a simplified investment decision.
A new social media app is about to launch an IPO and you have the opportunity to buy shares at a cost of $10 per share.
Step 1. We carry out an APO analysis
We consider all likely possible outcomes and scenarios affecting the share price of our potential investment.
- Social media app successfully takes over from Facebook & instagram and at some point in the future has a similar market capitalization.
Potential Share Price – $90 - The app turns out to be a millenial fad and they move on to the next big thing. Volumes and revenues never take off and the company share prices drops on negative growth.
Potential Share Price – $1 - There’s a privacy scandal and the app is shut down by the SEC
Potential Share Price – $0 - The app is not monetizable and advertising fails to bring in expected revenue growth
Potential Share Price – $2 - The app continues to gain some traction but fails to become dominant in the sector
Potential Share Price – $7 - The app does well but the stock market crashes in a recession
Potential Share Price – $5
Step 2. Estimate the frequencies of each event alongside the expected return:
- 25% @ $80
- 30% @ -$9
- 5% @ -$10
- 10% @ -$8
- 15% @ -$3
- 15% @ -$5
Now we have these assumptions we can work out the expected value of this investment.
Step 3. Calculate EV
EV = ($40*25%) + (-$9*30%) + (-$10*5%) + (-$8*10%) + (-$3*15%) + (-$5*20%)
EV = 20 -2.7 -0.5 -0.8 -0.45 -1
Add these figures together and we get the EV of this investment which is $14.55 for every $10 invested. Despite there being only a 25% chance that you will make back more than you invested. Which leads on to frequency of events and standard deviation.
Frequency
Now assuming we are confident in our calculations the above risk and reward makes it an attractive investment. However you probably wouldn’t want to remortgage your house and bet the farm on it as you’d have a 75% chance of losing everything.
However if you can find diversified opportunities which are +EV then you can accept more risk. For example if you found three opportunities like the above then we can work out our risk of ruin as follows.
Simplified version 25% win – 75% loss * 3;
75% * 75% * 75% = 42% risk of ruin
So you’ve tipped the odds in your favour of a positive outcome of one of these events occurring which would cover any potential losses from the others at 58%.
The more high, risk high EV bets or investments you make the lower your risk overall. This does however fall apart like a house of cards if the investments you make are correlated such as the stocks in a recession example.
Risk, Reward & ROI
While the above is fine for simplified examples in real-life scenarios you often won’t have time to write this out to analyse all the possible outcomes and variations in returns will be much more complex.
For fast calculations we can use estimated risk percentages and ROI which stands for return on investment.
For the stocks example we have a 25% chance of our $10 investment turning into $90. This gives a 800% ROI.
ROI = (Return – Cost) / Cost
$90 – $10 / $10 = 800%
Return on investment is really easy to calculate in a business scenario if you spend $100 and make back $120 your ROI is 20%. I’ve heard this referred to as a 120% ROI as well but for this example we will use the standard format.
So there’s a 25% chance of a 800% reward or ROI and 75% risk to half of the capital invested (-50% ROI).
800% * 25% = 200
-50% * 75% = -40~ish
200 – 40 = 160 = $16 EV for every $10 share.
So as you can see from our more detailed analysis we got 1.455 EV and from this mental arithmetic model we get 1.6 EV. It’s in no way shape or form perfect but it does allow for every day usage of quite complex decision theory.
The calculations however detailed or basic are only as good as the data or assumptions you are basing it on.
For most investments and business decisions if the EV is so close that you have to do a detailed analysis then there are probably other areas you should focus on.
In contrast to this, opportunities where there is a reasonable chance of more than a 100% ROI and your risk is only what you invest have high EV.
Time is Money
When using EV to make business decisions I think it is prudent to allocate a cost to the time resources the project or opportunity will take. You can use your hourly or daily wage or use an opportunity cost basis for this factor.
The time factor I tend to use is the time associated with testing an idea. This comes from the lean startup methodology. If a project will take a day to build but to scale it up might take a full team then I use a single day as the time factor for costings. At a later date there might be another decision to make as to whether it’s viable to scale the project.
Intangible Returns
There may be some decisions which aren’t just based on financial metrics. The opportunity to learn for example has huge value in doing any business activity. You might start one project where to return is negligible but you see an opportunity or pivot into something else where there is a greater opportunity that you wouldn’t have seen otherwise.
Intangible returns are hard to quantify and I tend to only use them in EV calculations if there’s a strong reason for doing something outside of financial gain. An example might be a charity project or saving energy by doing something that is negative EV but contributes to your environmental initiatives.
Conclusion
EV (expected value) is a calculation for the average outcome of future events. It can be calculated by multiplying the chance of occurance with the potential return for each possible outcome and then adding all the values together.
So for a coin toss there is a 50/50 chance of winning or losing $1. Our calculation would be (-1*50%)+(+1*50%) = 0 EV


