
These advertising and marketing statistics are derived from raw data on advertising and marketing trends in the UK, US and globally. Feel free to use any of the stats and/or images in 3rd party content but include a link back to this blog at https://jamesbachini.com
- Advertising Spend & Market Size Stats
- Performance Marketing Stats
- E-Commerce Stats
- Consumer Internet Usage Stats
- Social Media Stats
- Email Stats
👁️🗨️ Advertising Spend & Market Size Stats
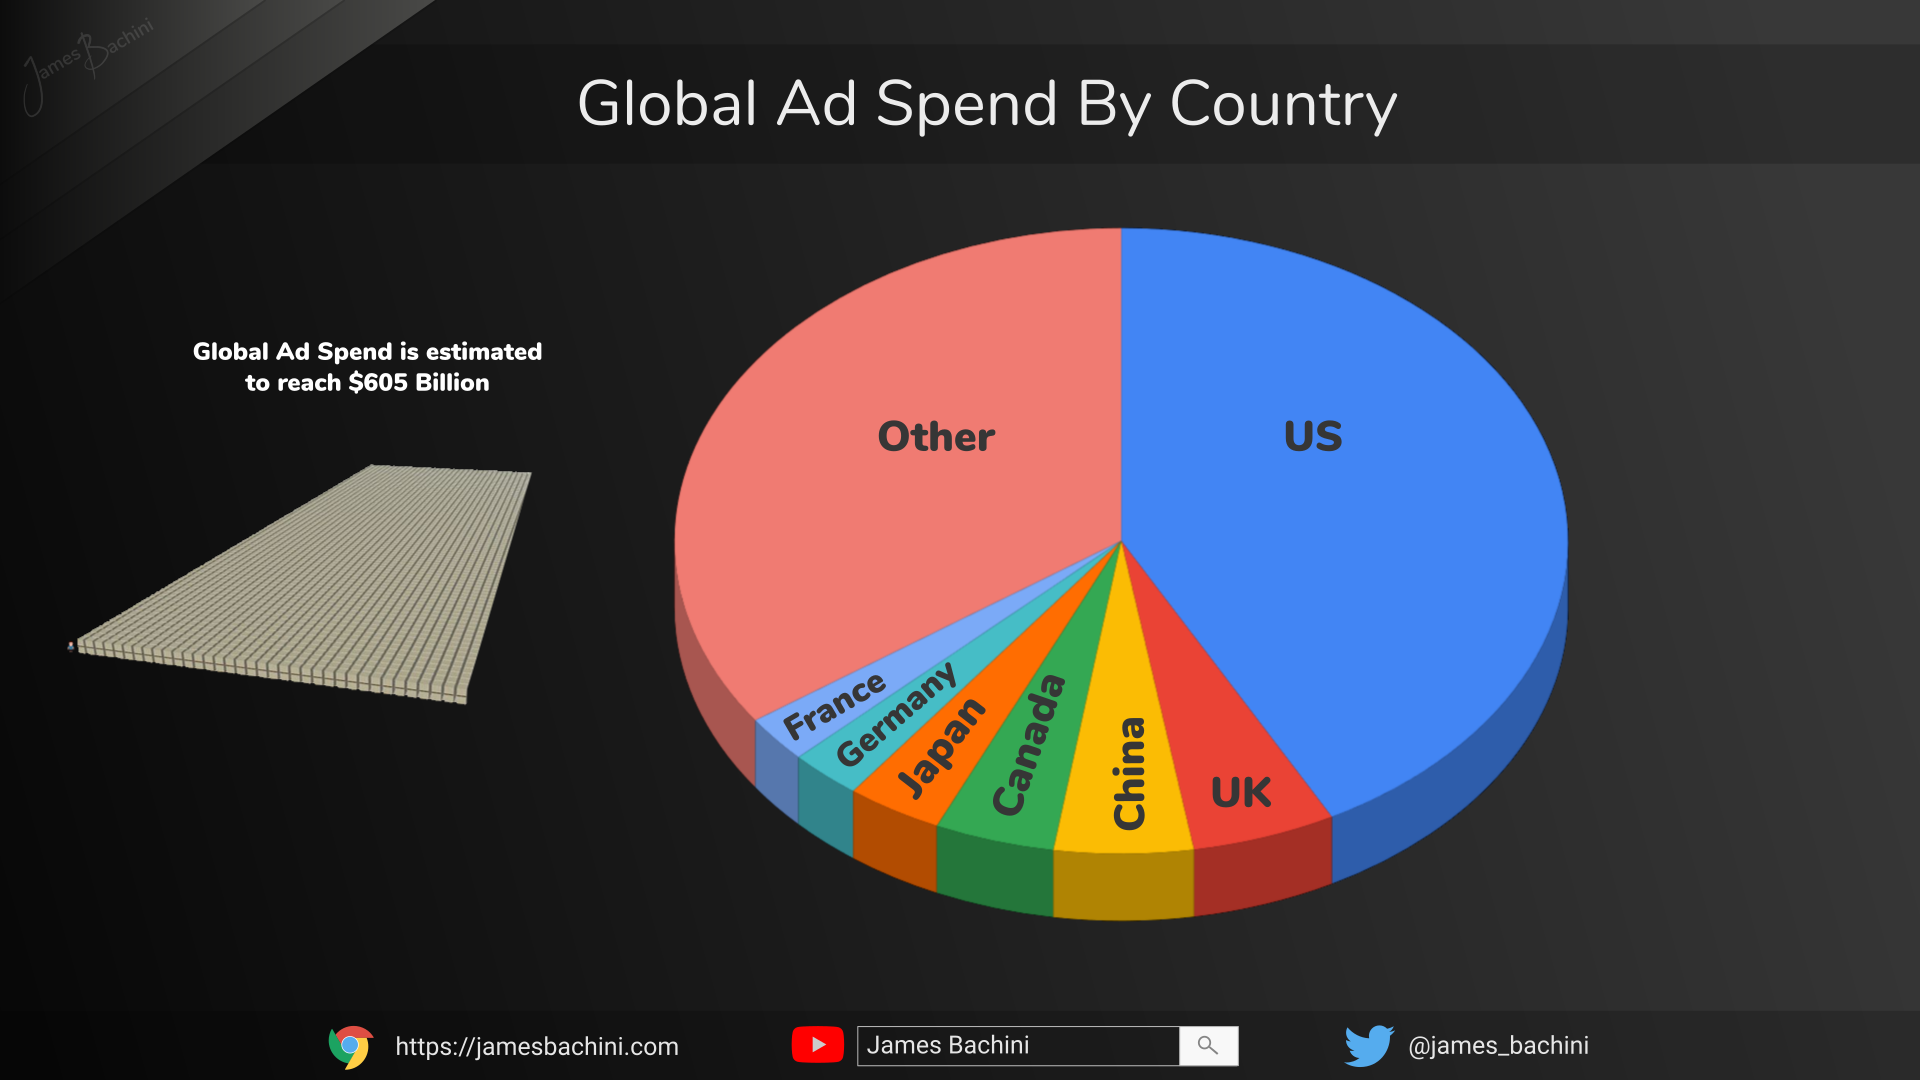
United States is the largest advertising market globally with ad spend estimated at $243 Billion USD in 2020. The UK is the largest in Europe with £24 Billion GBP estimated ad spend. Worldwide advertising market will reach over $0.6 trillion USD ($605 Billion estimated) in 2020.

Augmented and Virtual Reality market size in 2020 is £15 Billion GBP.
There were 205,000 advertising and marketing jobs in the UK prior to the Covid-19 shutdown.
Online ad spend overtook all other forms of advertising in 2017, reaching a 52% share of total advertising spending. In 2020 this figure is estimated to be 72%.
📈 Performance Marketing Stats
83% of online marketing campaigns do not A/B test landing pages
Average cost per action CPA is $49 for Google Ads search and $75 for display network.
The average UK internet user sees 33 banner ads, 22 search ads and 43 social media ads.
Ad blocker usage is growing in 2018 there were 142 million, 2019 615 million and in 2020 there is over 1 billion.
70% of surveyed marketing departments in the UK don’t have a content strategy in 2020.
🛒 E-Commerce Stats
Global consumer spending online expected to reach £3 trillion GBP in 2020 and £3.6 trillion in 2020
There are 300+ active Paypal accounts worldwide.
Average e-commerce spend per capita is $1800 in the US. I couldn’t find figures for the UK I calculated it as £3582 per capita from data on Statista but that doesn’t sound right compared to US.
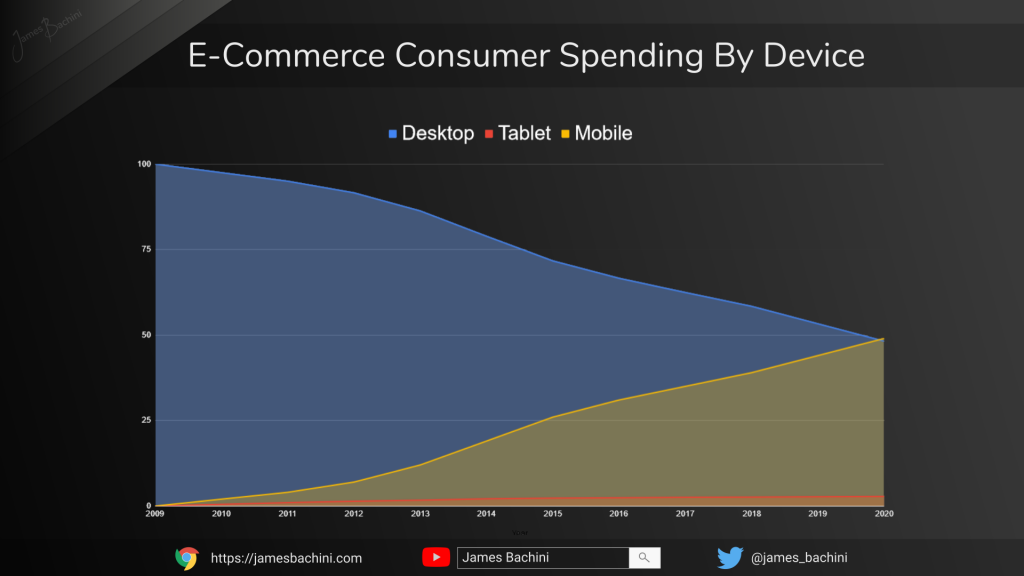
Current trend line suggests mobile phones will overtake laptops as the number one device for online shopping in late 2020.
Men spend 68% more money online than women according to a KPMG study.
36% of small businesses in the UK don’t have a website.
🌐 Consumer Internet Usage Stats
The vast majority of users own two or more internet connected devices. Only 12% of UK internet users operate a single device and 13% of US users.
50%+ of Google searches now end without a click on a result thanks to snippets and data presented in the search results pages. Google has a pretty bad bounce rate!
UK Search Engine Market Share 2020 = Google 90%, Bing 4%, Yahoo 3%, DuckDuckGo 1.5%, Other 1.5%
62% of mobile users have used voice assistance technology in 2020.
78% of UK adults own a smartphone in 2020. Worldwide is 44%.
Mobile phone market share in 2020 = Apple 20%, Samsung 18.8%, Huawei 15.2%, Xiaomi 8.9%, OPPO 8.3%, Others 28.7%
📱 Social Media Stats
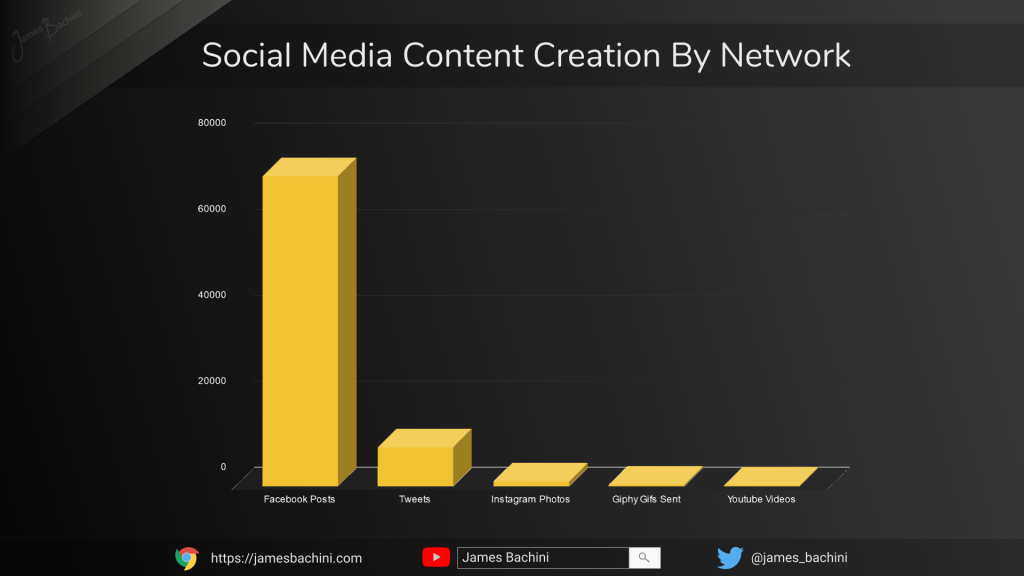
There are 9000 tweets sent every second in 2020.
There are 1000 photos uploaded to Instagram every second in 2020.
There are 333 Giphy Gifs sent every second across social media platforms.
There are 51 videos including 10 hours of content uploaded to Youtube every second in 2020.
There are 72000 Facebook posts every second in 2020.
Facebook has 2.6 Billion users in 2020.
Facebook ad revenues expected to reach £23 Billion GBP in 2020.
Facebook has 120+ million business pages
📧 Email Stats
Estimated number of emails sent per year is 102 trillion in 2020.
54% of emails are classified as spam meaning 550 billion spam emails get sent each year.
Cold email sales success rate is less than 1% on average across all sectors.
These stats were derived from raw data from sites such as Tableau, Statista, Forbes, Google Trends, RapidAPI, Facebook & Twitter. I’ve rearranged the data into standard formats changing monthly data into per second for example. Some data sources such as number of emails sent per year is an estimate based on the data available and is marked as so.
