

Volatility represents the degree of price fluctuation within a crypto asset, reflecting the magnitude of price changes over a given period.
It is the source of both risk and opportunity, capable of testing the nerves of even the most experienced investors. Understanding the nature of volatility is paramount, for it is through this lens that we gain insights into market dynamics, devise risk management strategies and seek to uncover hidden value amidst the turbulence.
- Understanding Volatility in Crypto Markets
- How To Measure Volatility
- Strategies For Trading Volatility
- Supercycle Thesis
- Embracing Volatility As An Opportunity
Understanding Volatility in Crypto Markets
Volatility can be measured in different ways but we generally talk about either historical volatility for past data or implied volatility for forward projections.
When markets have momentum these indicators rise because daily moves get larger. When markets are ranging for a period volatility indicators fall because price moves relatively slower.
Understanding this ebb and flow of volatility can help understand where you are in a market cycle and help position accordingly.
Right now in June 2023 we are in a ranging period where retail interest has died off and volatility is at an all time low. Bitcoin has effectively been going sideways since March.
How To Measure Volatility
Standard Deviation
Historical volatility is often assessed using some derivative of standard deviation. This is a metric used to measure the movement from an average (mean), it can be calculated as follows:
- Isolate a time period and calculate the mean of the data set by adding the values and dividing by the number of data points
- Subtract the mean from each data point, then square the result
- Calculate the mean of the squared divergences from mean, then take the square root of this value
Standard Deviation = √[average squared divergence from mean]
i.e. BTC weekly price: 27200, 27300, 27500, 27100, 27200, 27400, 27200
- 27200 + 27300 + 27500 + 27100 + 27200 + 27400 + 27200 / 7 = 27,271
- -71 29 229 -171 -71 129 -71 >>> 5041, 841, 52441, 29241, 5041, 16641, 5041
- √(5041 + 841 + 52441 + 29241 + 5041 + 16641 + 5041 / 7) = 127.77
Implied Volatility
The calculation of implied volatility involves an iterative process to find the volatility value that matches the market prices of options. This can be calculated using the black scholes model or we can check it using Deribit’s charts.
Here is the DVOL chart vs BTC price from Deribit:
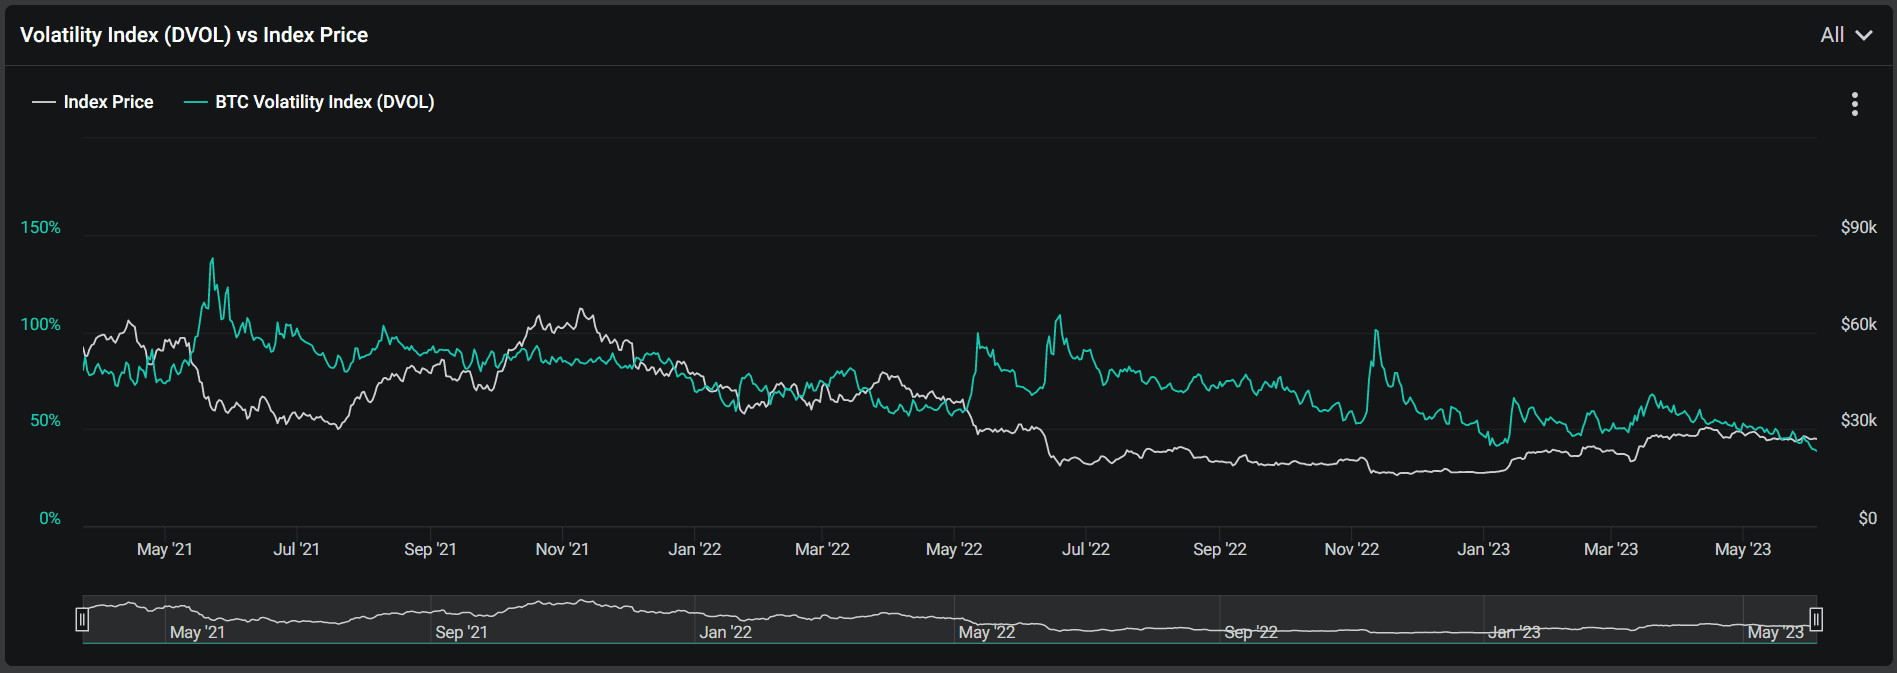
We can see that the market is pricing volatility at an all time low currently with DVOL below 40%. This follows a long period of sideways movement and lack of momentum in crypto markets.
ATR – Average True Range
When creating systems trading bots or risk management systems I tend to use ATR more frequently than standard deviation and IV.
It provides an indication of the average price range within which the instrument has moved during a look back time frame. It can be calculated like so:
- Determine the range for each period so for a 14 day ATR we calculate the price high minus the low for each day
- Add them together and divide by the number of periods to calculate the mean average. i.e. (range1 + range2 + range3… etc) / 14
ATR can be very useful when calculating things like trailing stop losses but it can also be used as an pseudo-oscillator to assess market volatility.
Beta
Beta isn’t necessarily a volatility indicator but is exceptionally useful comparing different assets and their risk profiles. In traditional finance it is often used to compare a stock to an index i.e. how much does Tesla move in percentage terms relative to the SP500. In crypto we generally use Bitcoin as the index and compare how a governance token moves relative to Bitcoin.
- Calculate the percentage returns over a period (i.e. 30 days) for both the token and Bitcoin. To do this, divide the close price of each period by the close price of the previous period and subtract 1.
- Calculate the covariance (use the COVAR or COVARIANCE.P spreadsheet function) between Bitcoins returns and the tokens returns. Covariance measures how the returns of two variables move together.
- Calculate the variance (use the VAR or VAR.P spreadsheet function) of the index returns. Variance measures the dispersion of returns for a single variable.
- Divide the covariance by the variance of the index returns. This will give you the beta coefficient.
Beta = Covariance(stock returns, index returns) / Variance(index returns)
If the beta is greater than 1, it indicates that the token is expected to be more volatile than Bitcoin. It tends to move more in magnitude compared to the index.
In bear markets most market participants tend to move into low beta digital assets. You’ll hear a lot of people talk about a flight to safety or holding only Bitcoin in a bear market. Then in a bull market the same people will move up the risk curve allocating funds at the worse possible time to high beta products. Measuring your entire portfolio beta relative to BTC and logging it can help avoid this pitfall where our human psychology for pain aversion and greed works against us.
Strategies For Trading Volatility
Ideas around trading volatility are often expressed via options contracts.
If we expect volatility to increase and options are cheap (market is pricing in low IV) then we could potentially put on a straddle where we buy both call and put options. This means we get paid if price moves either up or down away from the current price over a period of time.
If we expect price to go in to a ranging period where it does very little and goes sideways we can be a seller of options and express the opinion that way. To sell options we deposit collateral on an exchange much like with futures trading, if price moves too far against the position then the collateral can get liquidated.

There’s more information about trading options in this article on Deribit and options trading.
Supercycle Thesis
The term supercycle was popularized by Su Zhu of Three Arrows Capital, although I believe it was initially coined by Dan Held. The theory suggests that Bitcoin will gradually become less volatile and exhibit a consistent pattern of growth, drawing a comparison to Amazon’s long-term trajectory.
While a crypto supercycle may not follow the exact same path, it is characterized by steady price appreciation and diminishing volatility. Over time, most products tend to increase in value due to inflation, but Bitcoin has shown a history of price appreciation surpassing inflation levels due to factors like network growth and wider acceptance.
As markets mature and trading mechanisms improve, volatility typically decreases. Bitcoin’s 4-year market cycles demonstrate this trend, with each cycle showing less extreme price movements.
- 2011 Bitcoin dropped -94%
- 2015 Bitcoin dropped -87%
- 2019 Bitcoin dropped -84%
- 2023 Bitcoin dropped -78%
- 2027 Crash for ants 🐜
The supercycle theory did not fare well for Three Arrows Capital, as they faced financial difficulties due to overleveraging and illiquid assets. Nevertheless, the failure of one fund does not necessarily negate the possibility of a Bitcoin supercycle; it may simply indicate that the timing was premature.
Embracing Volatility As An Opportunity
Volatility in crypto markets can be both daunting and exhilarating. While it poses risks, it also presents opportunities for those who understand its nature and navigate it wisely. By delving into the intricacies of volatility, market dynamics can be better comprehended, and strategies for risk management can be developed.
Embracing the volatility of crypto markets requires strong faith in the underlying technology and its long-term potential. By remaining informed, staying in the game and recognizing the opportunities, investors can navigate the volatile terrain and potentially capitalize on its fluctuations.