In this Dune Analytics Tutorial we will look at how the platform works and get up to speed with creating our own queries, visualisations and dashboards to analyse and present blockchain data.
- Queries, Visualisations & Dashboards
- PostgreSQL Basics For Dune Analytics
- Creating A Dune Analytics Dashboard
- Custom Contracts & Event Logging
- Embedding KPIs From Dune Into Website
Queries, Visualisations & Dashboards
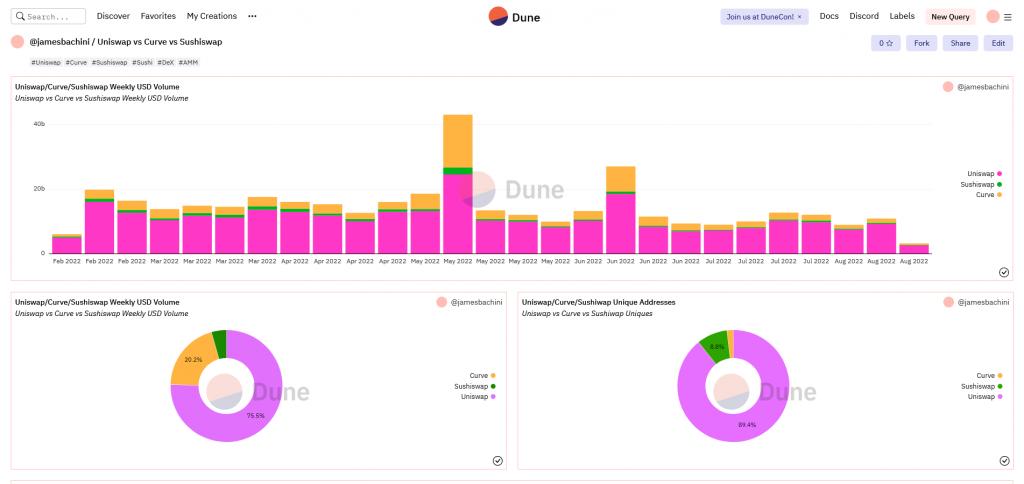
Dune Analytics dashboards are built using a 3 step process. First we make SQL queries to pull data into tables, then we create visualisations (charts and graphs) of that data, before finally inserting those into a dashboard like this:

To get started I generally pull all the data from a source to see what is available with a query such as:
SELECT *
FROM dex.trades
LIMIT 100;
We will cover the basics of SQL in the next section but this will provide a data table which looks like this:

From there we can narrow our query down to select and manipulate the data we want to work with.
Note that in the table above the trader_a addresses are formatted “\x…” rather than “0x…” this is a common gotcha to be aware of whenever inputting an address into a Dune SQL query.
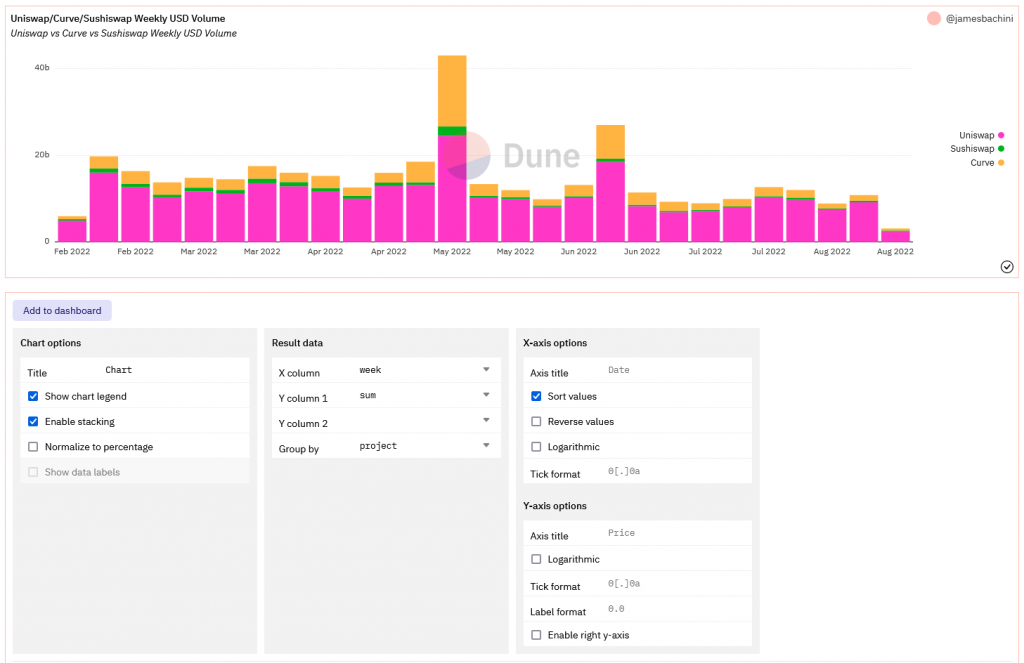
From there we can go ahead and create a “New Visualisation”

And create a nice chart like this one:
This shows the weekly USD volume and active users on OpenSea, the leading NFT marketplace.
Finally we can add charts to our own custom dashboards and publish these in the Dune Analytics Discover section.
PostgreSQL Basics For Dune Analytics
50% of learning to use Dune Analytics is knowing where the data is, the other 50% is remembering how to use SQL. Let’s do a refresh for those of us who haven’t used it in the last decade and were kind of hoping they’d never again have to…
SQL is a relational database where data is stored in tables with columns and rows similar to a spreadsheet. We can access that data using SQL commands like SELECT * FROM myTable which will dump the whole table into the output.
Common SQL Commands For Dune Analytics
| Command | Description |
|---|---|
| SELECT | Describe what data you want, * is everything or name the individual fields separated by commas |
| FROM | Describe which dataset you want to access |
| WHERE | Describe a filter using a key and a value such as WHERE blockchain = ‘Ethereum’ |
| AND | Create an additional key => value filter AND wallet = ‘/x123…’ |
| OR | OR filter, these can be combined with AND filters and used in brackets i.e. WHERE query1 OR (query2 AND query3) |
| LIMIT | Create an output limit to speed up processing and avoid massive outputs |
| GROUP BY | Give the key you want to group by, in Dune you can just give the number as well i.e. GROUP BY 1 for the 1st item selected |
| SORT BY | Sort the output rows by a certain key, useful when using dates etc. |
| SUM | Add all the selected values together SELECT SUM(usd_value) |
| COUNT | Count the number of values, can be used with DISTINCT as well to count unique wallets for example: SELECT COUNT (DISTINCT buyer) AS uniqueBuyers |
| AS | Creates a new key for the output, see example above |
| MAX | Outputs the maximum value from a query SELECT MAX(usd_value) |
Working With Times & Dates
Often we want to display time based data in our charts. Let’s look at an example
SELECT date_trunc('week', block_time) AS week,
COUNT (DISTINCT token_b_symbol) AS uniqueAssets
FROM dex.trades
WHERE block_time >= NOW() - interval '180 day'
GROUP BY 1;
In the code above we are truncating the block_time into weeks (we can also use hour, day, month etc). We then set a WHERE filter to ensure that block_time is greater than 180 days ago. This will provide a graph for the last 180 days grouped by weekly data points.
Combining Data With Joins & Unions
At some point we will want to combine data from different tables. We can do this with Joins where we want to join a column from one table with another and Unions where we want to combine rows of data. Let’s look at two examples to demonstrate this:
SELECT * FROM
(SELECT 123 AS meh) AS foo
JOIN
(SELECT 456 AS meh) AS bar
ON table1.field1=table2.field2;
+-----+-----+
| foo | bar |
+-----+-----+
| 123 | 456 |
+-----+-----+
SELECT 123 AS meh
UNION
SELECT 456 AS meh;
+-----+
| meh |
+-----+
| 123 |
| 456 |
+-----+A join combines similar data from different tables connecting it at the point set at ON. A union returns the results of two different queries from a data set. Union by default removes duplicate rows, if this is not intended then use UNION ALL.
Creating A Dune Analytics Dashboard
In this example we are going to be working with the dex.trades data set to build out an analysis of 3 different decentralized exchanges.
Let’s first look at what data we have available:
SELECT  *
FROM dex.trades
LIMIT 100;
We can see from the output we have the following fields:
- block_time
- token_a_symbol
- token_b_symbol
- token_a_amount
- token_b_amount
- project
- version
- category
- trader_a
- trader_b
- token_a_amount_raw
- token_b_amount_raw
- usd_amount
- token_a_address
- token_b_address
- exchange_contract_address
- tx_hash
- tx_from
- tx_to
- trace_address
- evt_index
- trade_id
We can then build a query to calculate the weekly trading volume for each exchange using the usd_amount values.
SELECT  date_trunc('week', block_time) AS week,
        project,
        SUM(usd_amount)
FROM dex.trades
WHERE (project = 'Sushiswap' OR project = 'Uniswap' or project = 'Curve')
AND block_time >= NOW() - interval '180 day'
GROUP BY 1, 2
ORDER BY 1 desc;
So we are grouping these by week and project and then ordering by the week in chronological order. We can then create a nice stacked bar chart to visualise the data.

We can then create similar queries for unique user addresses and unique assets traded using trader_a and token_b_symbol.
SELECT  COUNT (DISTINCT trader_a) AS uniqueUsers,
        project,
        date_trunc('week', block_time) AS week
FROM dex.trades
WHERE (project = 'Sushiswap' OR project = 'Uniswap' or project = 'Curve')
AND block_time >= NOW() - interval '180 day'
GROUP BY 2,3
ORDER BY 3;
Pull all of these into a dashboard and click “EDIT” to move them around and space them out and we have something like this:
https://dune.com/jamesbachini/uniswap-vs-curve-vs-sushiswap
Custom Contracts & Event Logging
For blockchain developers may want to create visualisations and KPI dashboards for our own contracts. To do this we can verify the contracts in Dune and analyse the event log.
To verify the contract submit it here with the ABI: https://dune.com/contracts/new
You can get the ABI from Remix or in the artifacts directory of Hardhat. It’s also on Etherscan for contracts that have been verified on there.
Verification usually takes 24 hours, if you can’t wait that long or for any reason we can’t verify the contract we can access the raw event logs in the Dune Analytics table ethereum.logs. This will require decoding the individual topics with a function such as BYTEA2NUMERIC().
SELECT *,
BYTEA2NUMERIC(topic3)
FROM ethereum.logs
WHERE contract_address = '\xA0b86991c6218b36c1d19D4a2e9Eb0cE3606eB48'
AND topic1 = '\xddf252ad1be2c89b69c2b068fc378daa952ba7f163c4a11628f55a4df523b3ef'
LIMIT 100;
topic1 in the code above filters the results by the event identifier, this is unique to the Transfer event for the USDC contract and can be found on Etherscan in the event log under topic0.

Let’s take a moment to look at how events work on Ethereum and other EVM blockchains. Events can be fired form Solidity and are included in most token libraries etc. Here is an example:
// SPDX-License-Identifier: MIT
pragma solidity ^0.8.16;

contract Events  {
  event LogThis(string msg);

  function test() external {
    emit LogThis('Hello World');
  }
}
We define the event at the top of the contract and then emit it from within functions when needed, similar to Javascript events.
We can see events being fired in the Etherscan event log. Check out the Transfer and Approval events in a common ERC20 token such as USDC: https://etherscan.io/address/0xa0b86991c6218b36c1d19d4a2e9eb0ce3606eb48#events
Once a contract has been verified we can access the events directly with decoded outputs.
First we need to find out what the namespace is for the verified contract using the contract address, you can also guess most of the time or use the search function.
SELECT *
FROM ethereum.contracts
WHERE address = '\xA0b86991c6218b36c1d19D4a2e9Eb0cE3606eB48'
This shows the namespace as circle so we can look that up and see that there is a circle.”USDC_evt_Transfer” table. Let’s see what this has in it.
SELECT *
FROM circle."USDC_evt_Transfer"
LIMIT 100;
We have a nice table of decoded data to work with because the contract has been verified.
Embedding KPIs From Dune Into Website
One of the things I think Dune is most valuable for is monitoring key performance indicators internally or on external sites.
We can create our own dashboards in dune or embed visualisations into our own HTML pages using iframes.
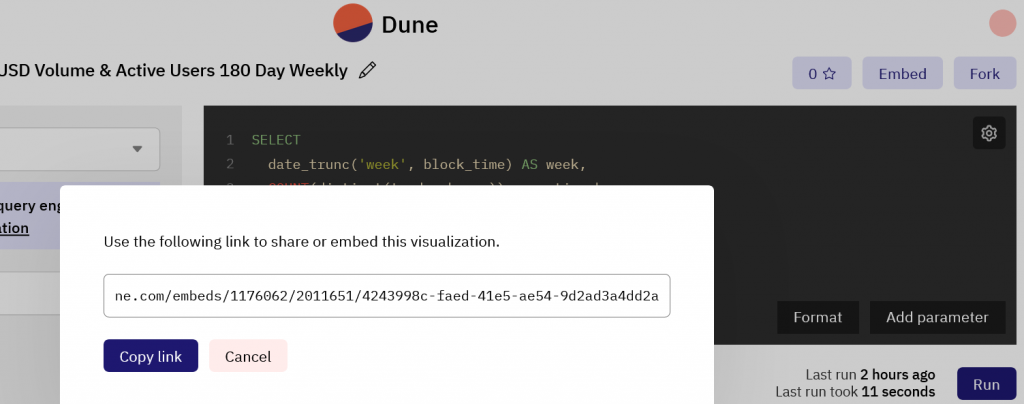
Simply save the function and visualisation and then click the embed button in the top right to get a link.

From there we can add this to an iframe using the code below:
<iframe src="https://dune.com/embeds/1176062/2011651/4243998c-faed-41e5-ae54-9d2ad3a4dd2a" height="500px" width="100%" title="chart 1"></iframe>This will create a nice embedded interactive chart like this one.
From there we can go on to build complete dashboards of data visualisations for competitor analysis, key performance indicators and on-chain activity.


