
Impermanent Loss Calculator
Enter the quantities for the two assets in a full-range liquidity pool and a future price ratio to find out what the impermanent loss would be:
Token Asset Qty:
Future Price Ratio:
How Impermanent Loss Is Calculated
In this article we will look at what impermanent loss is, how to calculate impermanent loss and how to reduce risk exposure.
- Impermanent Loss [Video]
- What is Impermanent Loss?
- Understanding Liquidity Pools
- Liquidity Provider Risk
- Calculating Impermanent Loss
- Correlation Between Assets
- Hedging Price Movements
- Conclusion
Impermanent Loss
This video covers what impermanent loss is and how we can understand and mitigate it. There are more details, calculations and charts in the article below.

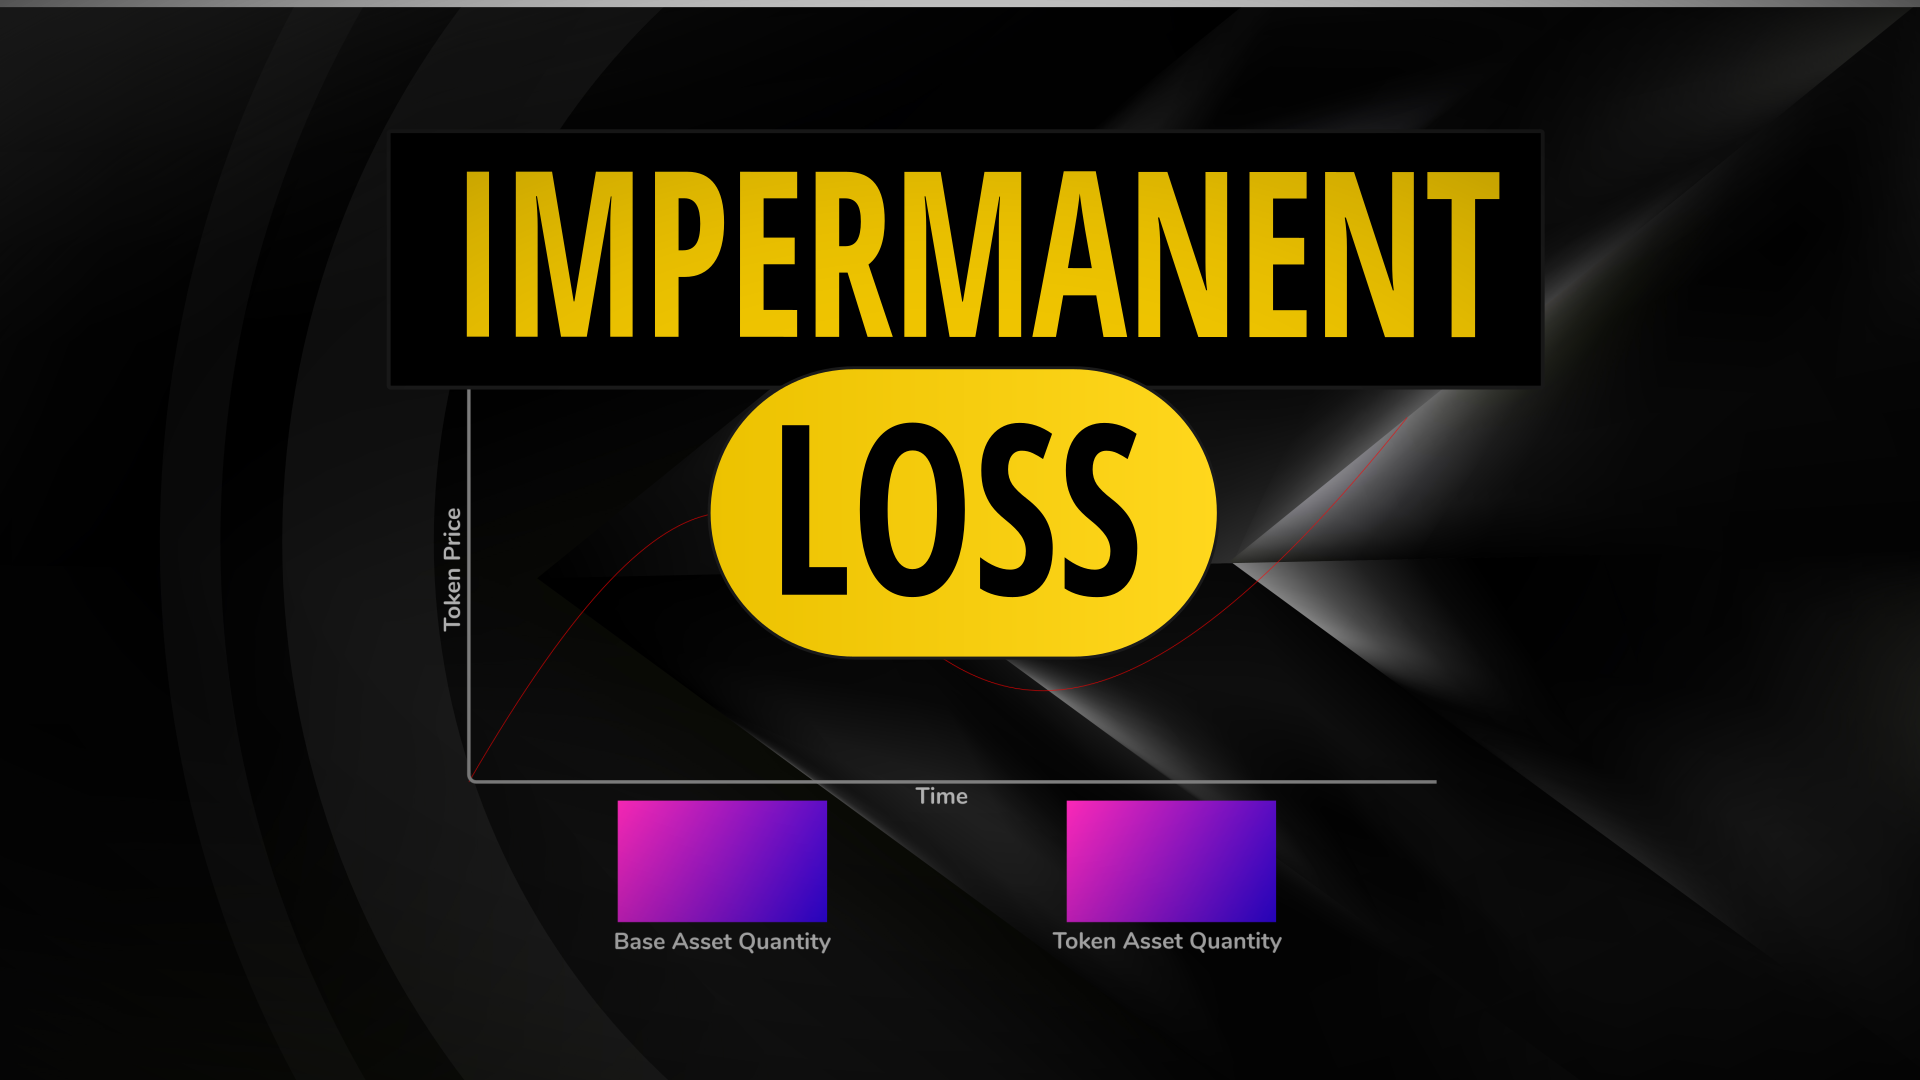
What is Impermanent Loss?
Impermanent loss is the effect where if one asset in a liquidity pool is purchased the price increases along the curve but there is less of that asset in the pool. The liquidity providers own the same percentage share of the total pool meaning they now own less of the more valuable asset.
If price returns the pool rebalances such is often the case with stablecoins however if the price keeps moving the loss or opportunity cost is very much permanent. For taking this risk liquidity providers are rewarded with trading fees.
Understanding Liquidity Pools
To fully understand impermanent loss we need to first know how liquidity pools function. Liquidity pools such as those used by popular automated market makers such as Uniswap and Sushiswap contain a pair of assets. A pool might contain a base asset such as ETH or USDT and a more volatile asset such as a new governance token for example.

A liquidity provider will send both assets to the pool. In return they will receive LP tokens which will entitle them to a share of the pool.*
A trader can use the pool to swap ETH for the token. This adjust the ratio of quantities in the pool because they are adding ETH and taking away the tokens.
The liquidity provider still owns the same percentage of the total pool but it now contains more ETH and less tokens.
The price of the token is also adjusted because it is calculated based on the ratio of quantities in the pool. If traders keep buying the token the quantity is depleted and price goes up.
The liquidity pool contains less of a more valuable token. This is where impermanent loss comes in because the liquidity provider has lost some value in the pool.
To compensate the liquidity provider most automated market makers will charge a fee of around 0.3% per trade paid directly into the pool increasing it’s value over time.
If the trader then sells their tokens they return them to the pool and take out their ETH. This rebalances the pool and both the price and quantities return to the original values however the fees have increased the total funds in the pool. The loss in value the liquidity provider originally suffered was indeed impermanent.
* On a side note Uniswap v3 introduced non fungible LP tokens which are specific to the concentrated liquidity position.
Liquidity Provider Risk
Impermanent loss becomes an issue when price diverges between the assets and doesn’t come back. In this situation a liquidity provider loses out because of the diminishing quantity of the asset that is increasing in price in the pool.
Price movement is relative to the base asset. If the liquidity pool is UNI/ETH and both ETH and the UNI token go up in value together relative to USD then there isn’t actually any change in the pricing in the pool.
The liquidity provider risk is compensated by transaction fees. More active pools earn more fees because there are more trades in the pool.
Uniswap v3 introduced variable fee ranges to better align the risk of impermanent loss with the trading fee.
- Stablecoins 0.05%
- Standard 0.3%
- High volatility 1%
Calculating Impermanent Loss
ImpermanentLoss = PoolValue / HoldValue – 1
So impermanent loss is the opportunity cost relative to holding the assets at fixed quantities.
Automated market makers use a simple formula x * y = k
X is the quantity of the base asset, Y is quantity of the second asset, and K is the product constant of the pool.
Let’s look at an example where the UNI/ETH pool contains 12605 ETH and 1,459,747 UNI tokens and one UNI costs 0.008635 ETH. The total value locked (TVL) in the pool is 25,210 ETH.
We can calculate the product constant as 12605 * 1,459,747 = 18,400,110,935
Now let’s assume that the Uniswap doubles in value relative to ETH. Even if this happens on centralized exchanges arbitragers will swap ETH for UNI tokens until the price is met in the liquidity pool. The price ratio will now be 0.01727 as the cost in ETH terms has doubled.
We can use the following formula to calculate the quantity of assets in the pool at any price point.
$uniQty = sqrt($priceConstant / $priceRatio);

$ethQty = sqrt($priceConstant * $priceRatio);
So in the UNI/ETH example we have the new quantities in the pool:
$uniQty = sqrt(18.4e9 / 0.01727) = 1,032,197

$ethQty = sqrt(18.4e9 * 0.01727) = 17,826
How would liquidity providers be affected by this price change?
The total pool including UNI tokens was originally valued at 25,210 ETH, it is now valued at 35,652 ETH because of the value increase in the UNI side of the pool. However if those same fund had just been held rather than committed to a liquidity pool they would be worth 37,815 ETH. Our impermanent loss is 2,163 ETH or 5.7%. Note this doesn’t take into account fee accrual over our imagined time frame that the asset doubled in value.
So we can put this formula into a Javascript function to calculate impermanent loss:
const baseQty = 12605;
const tokenQty = 1459747;
const futurePriceRatio = 0.01727;

const calcImpermanentLoss = (baseQty, tokenQty,futurePriceRatio) => {
  const productConstant = baseQty * tokenQty;
  const hodlStrategy = ((tokenQty * futurePriceRatio) + baseQty);
  const lpStrategy = ((Math.sqrt(productConstant / futurePriceRatio)) * futurePriceRatio) + (Math.sqrt(productConstant * futurePriceRatio));
  const impermanentLoss = (hodlStrategy - lpStrategy) / hodlStrategy * 100;
  return impermanentLoss;
}

console.log(calcImpermanentLoss(baseQty,tokenQty,futurePriceRatio));
We can now use this function to plot a graph across many price points.

As a rough rule of thumb we can use this to calculate that a 50% price change relative to the base asset results in a 2% loss for liquidity providers.
The other side of this that we would need to consider is the fee revenue which isn’t taken into account.
We can see how much fees have been accrued by checking trading volumes.
https://info.uniswap.org/#/pools

The Uniswap UNI/ETH pool for example has $91m TVL (total value locked) and $177m in 7 day trading volume.
The fee rate for that pool is 0.3% which means that over the seven days $531,000 USD in fees has been added to the pool. This divided by the TVL means that for every dollar provided by liquidity providers they’ve increased their holdings by $0.0058 which is roughly 30% APR. Note this doesn’t take into account the effects of concentrated liquidity positions. From the impermanent loss chart we can calculate that the UNI token would need to lose in excess of 80% of it’s value relative to ETH over the course of a year for this to be unfavourable for liquidity providers.
Correlation Between Assets
An ideal situation for liquidity providers is a pool with lots of trading but very little price movement. Stablecoin pools for example like USDT/USDC get traded regularly but aren’t expected to fluctuate in price.
Other assets tend to move in unison as well. ETH and DeFi tokens tend to go up and down together and the more established higher market cap coins have a higher correlation. In contrast new tokens, meme coins and other highly volatile assets can have wide swings in price relative to any base asset leading to greater impermanent loss.
For established tokens we can use Trading View to look at ranges and compare trading pairs.
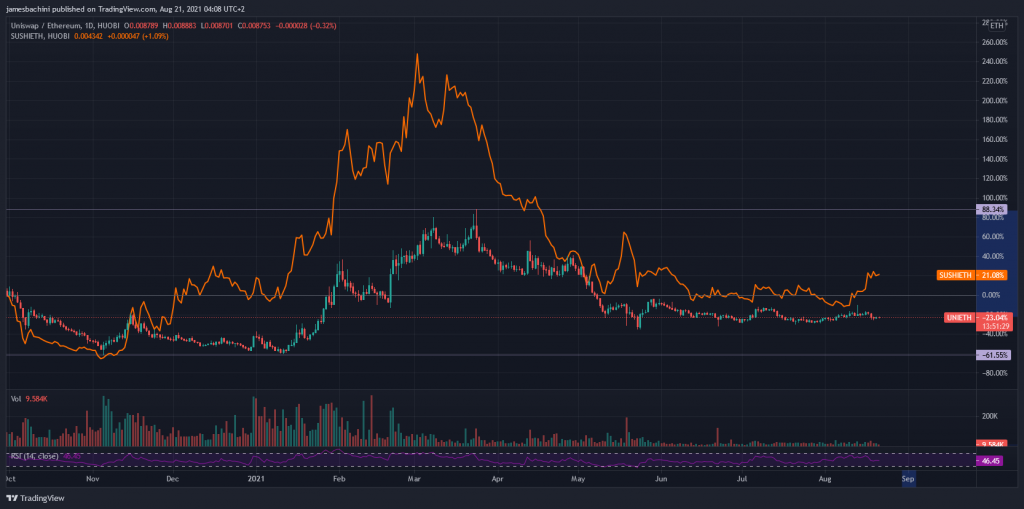
In the example above we are plotting UNI/ETH and adding a comparison indicator for SUSHI/ETH. I’ve marked on the high time frame top and bottom of the range for UNI.
With all other things equal it seems UNI is less volatile compared to SUSHI which would benefit liquidity providers in that pool.
Hedging Price Movements
The issue with hedging impermanent loss is that it occurs in both directions and you need to have some idea of where the risk lies. If UNI reaches a level and looks like it’s going to breakout and go up 50% against ETH it’s trivial to take out a long position to cover the 2% risk to impermanent loss. However if that turns into resistance and the UNI token price crashes back down the hedge gets crushed and you still get impermanent loss on the downside.
In the past it’s been difficult to actively manage LP positions because ETH gas fees have been so expensive. With Eth2.0 and layer 2’s I think there is going to be much more room for mitigating risk during periods of high volatility. There are a number of ways to measure market volatility but one of my favourites is the DVOL index from Deribit. This is a forward looking indicator as it’s based on the options positions and market participants expectations of the next 30 days volatility in Bitcoin price.

A rough rule of thumb is to divide DVOL by 20 to get a daily expected move in Bitcoin price.
So this can be used to get an idea of Bitcoin volatility which will affect the overall market. We can use simple technical analysis on Trading View as well to build a thesis of how volatile a specific trading pair is likely to be in the coming weeks. If Ethereum gas fees permit it during periods of peak volatility we can simply close the liquidity position until the market stabilises.
Note that the worse times for liquidity providers will coincide with the periods where gas prices and network congestion are at their highest levels.
In the future it’s not impossible to think that this could be automated within a smart contract strategy for managing liquidity positions.
Conclusion
Liquidity providers accept the risk of impermanent loss in exchange for transaction fees. Quantifying that risk and assessing and mitigating it is somewhat complex but not impossible.
- We can calculate the impermanent loss at any price point using the chart and function in the article.
- We can calculate fee revenues by looking at the trading volumes and total value locked.
- We can compare trading pairs to find the most correlated assets
- We can mitigate some risk by removing liquidity during periods of expected volatility
