
In this article we look at Key Performance Indicators, how to define them, review them and how you can set up a KPI dashboard for your business.
- KPI’s in 90 Seconds
- What are Key Performance Indicators?
- What makes a good KPI?
- Categories of KPI and 34 Key Performance Indicator Examples
- Steps To Defining KPI’s
- Setting up a KPI dashboard
- Conclusion
KPI’s in 90 Seconds

What are Key Performance Indicators?
Key performance indicators are the mission critical metrics that make the most difference to your business. Organisations use KPI’s to focus efforts in the right areas and to measure and evaluate performance.
The most common KPI is “revenue” which defines how much money is coming into the business through sales and income streams. The metric itself isn’t enough though, when we define KPI’s we should also set target values which can be reviewed at a later date.
By having a clear idea of where the business is and where it needs to get to we can come up with a timeframe and set of quantifiable KPI’s to assess the progress.
What makes a good KPI?
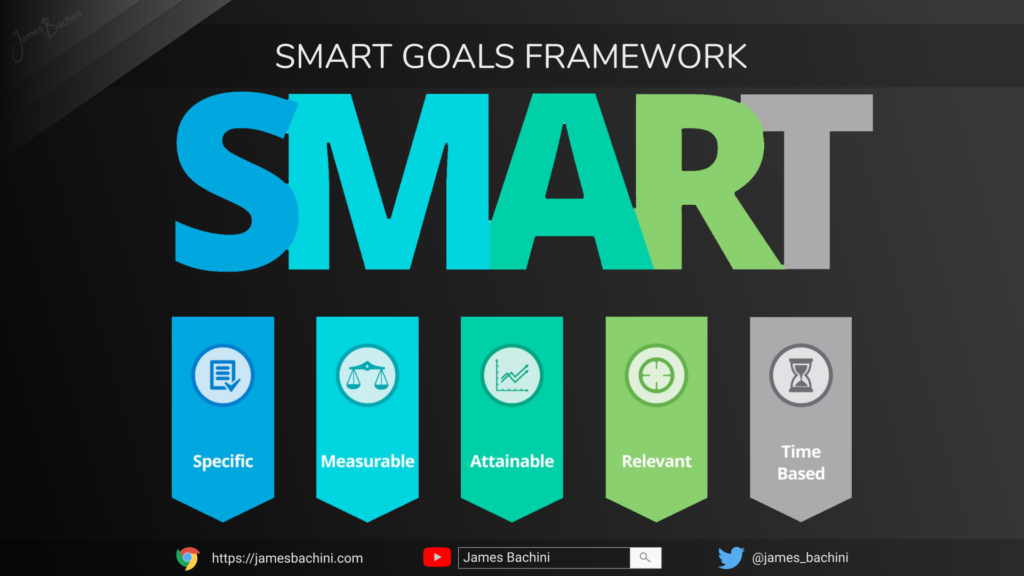
I like to use the “SMART” framework which is usually quoted for defining personal goals but also works well for KPI’s.
A great KPI should be:
- Specific to a particular objective of the organisation
- Measurable so it can be tracked and reviewed
- Attainable optimistic but realistic prediction metrics
- Relevant to the overall goal of the organisation
- Time-frame for the attainable future KPI levels
Categories of KPI and 34 Key Performance Indicator Examples
Financial KPI Metrics
- Revenues
- EBITDA, Earnings Before Interest, Taxes, Depreciation & Amortization
- Segmented revenue by product/location/campaign
- Fixed Costs
- Product Costs
- Profit margins
- Burn rate (funding runway remaining)
- Growth rate
- Market share
- Quick ratio / Acid test
- ROI Return on investment
- Operational cash flow
Customer KPI Metrics
- Customer lifetime value
- 7 or 30 day customer retention
- Churn rate
- Repeat purchase percentage
- Cost per new customer acquisition
- Customer satisfaction
Organisation KPI Metrics
- Customer support response time
- Employee satisfaction
- Employee turnover rate
- R&D results
- Time to Market
- Milestones
- Inventory levels
- Order Fulfillment Time
Marketing KPI Metrics
- CPA – Cost per action/lead
- Lead to sale conversion rate
- Monthly volumes
- Abandoned cart ratio
- Average order value
- Monthly visitors/users
- Press releases published
- Social indicators, follows, likes
Steps To Defining KPI’s
- The first step to defining the core KPI’s is to analyse the business objectives for the short and long term. Go through the list of metrics below and consider any additional ones specific to your industry. Highlight the metrics that are most important to your organisation. Less is more.
- Gather the necessary data to make an accurate assessment of each KPI value as of today.
- Set targets for each metric which should be realistic enough to be attainable but optimistic enough to motivate and challenge the organisation.
- When defining KPI’s it’s also important to decide on the review procedure whether that be weekly, monthly or quarterly. The key personnel who influence the metrics and any stakeholders should have instant access to the current KPI metrics at any time. We’ll look at setting up a KPI dashboard in the next section.
Setting up a KPI dashboard
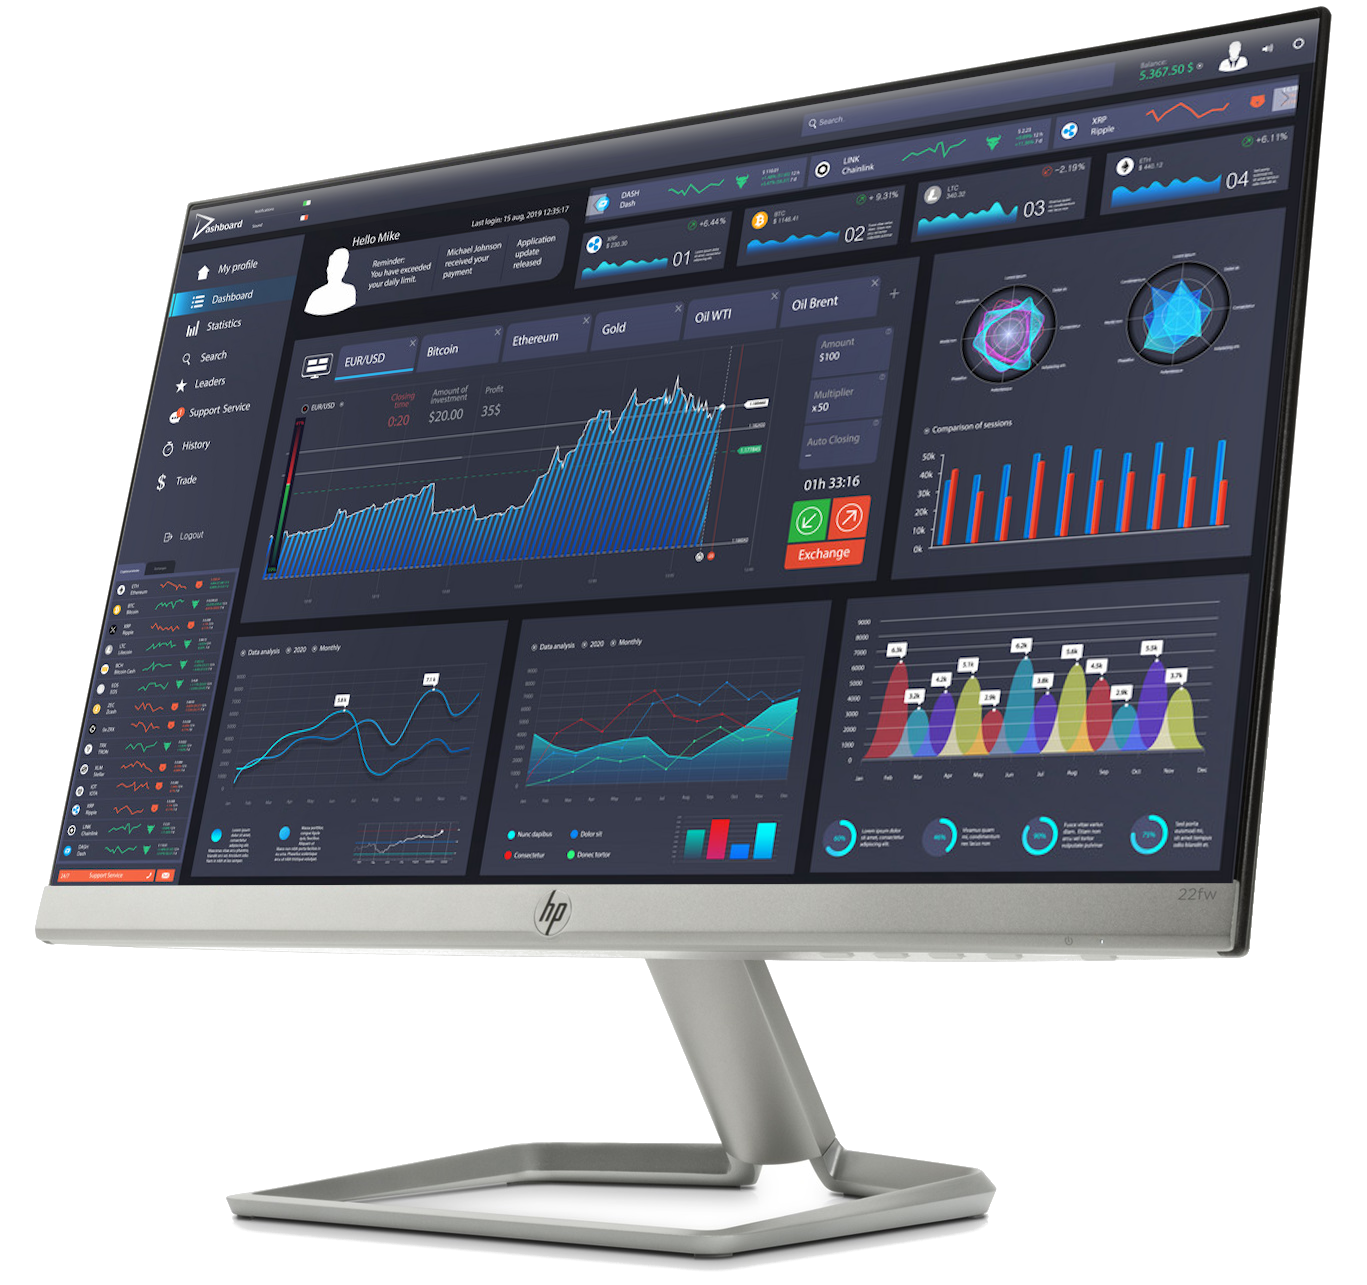
A KPI dashboard is usually a single web page frontend served over an intranet or protected internet connection.
There are plenty of 3rd party companies that specialise in KPI dashboards and streamlining company data.
However I’m a developer so naturally everything looks like a webdev project and I’d recommend building something yourself which will be much more adaptable and specific to your business.
The front-end doesn’t need to be complicated, just a responsive page that displays the data via a simple, clear minimalist dashboard.
The back-end is where it will get interesting and this is the bit 3rd party SaaS platforms can’t help with all that much. For web based businesses many of the data points should be in Google analytics which has a reporting API. Other metrics may need integrating with accounts/financial systems or legacy data sources.
Learn more about Analytics & Tracking in the module here:
https://jamesbachini.com/analytics-strategy/
All metrics should already be reported in one way or another and it’s just a case of getting to them programmatically. If a sales team is reporting leads to the sales manager in excel spreadsheets via email we could move this to Google docs and then link up an API query from there.
The data should be fetched and recorded at least daily. The dataset itself wont be big so it can be logged daily and historical data stored in a single database or cloud storage facility. From there the front-end can access it via normal database or API queries. Any sensitive data will need protecting via a logged credentials system and data stored in a secure location.
Once built the dashboard can be saved as a bookmark, linked to from a website or set as the web browser home page so it opens up whenever a user opens a new tab.
Conclusion
Defining key performance indicator metrics encourages a company to focus on the most important aspects of the business. Pareto’s principle states that 80% of results come from 20% of efforts and the core KPI’s should clearly define what quantifiable measurements we can take from that critical 20%. Setting targets and regular reviews makes the key employees accountable and encourages performance.
A KPI dashboard provides an up-to-date vitals check for the business which is accessible at any time and keeps all stakeholders informed of evolving business environments.
