

This module is part of a free online course where you can learn digital marketing.
How to create an analytics strategy to track visitor metrics, provide actionable insights into performance and establish data driven marketing methodology for continuous improvement.
- [Video] Creating An Effective Analytics Strategy
- Why Analytics & Privacy Are Important
- Roadmap For Developing An Analytics Strategy
- 5 Important Analytics Insights
- Setting Up Google Analytics
- Managing Pixels In Google Tag Manager
- Analyzing Data In Google Data Studio
- Alternatives To The Google Tools
- Internal Data Analytics
- Conversion Tracking & Optimization (CRO)
- Retargeting & Audience Pixels
- Qualitative Data Sources
- Data Driven Marketing
- Analytics Cheat Sheet [PDF]
Creating An Effective Analytics Strategy

Why Analytics & Privacy Are Important
Tracking visitor data is critical to performance marketing methodology. It provides the insights needed to make data driven decisions and continuously improve marketing campaigns.
Let me be clear from the start that I am talking about anonymous quantitative data here and not tracking individuals by name around the web. Privacy concerns are at an all time high and browsers like Brave have blocked 3rd party tracking software. The tracking and analytics described here provide metrics such as how many visitors a site has had today, which pages are most popular, how fast the site loaded. All critical information to the creator and marketer.
Roadmap For Developing An Analytics Strategy
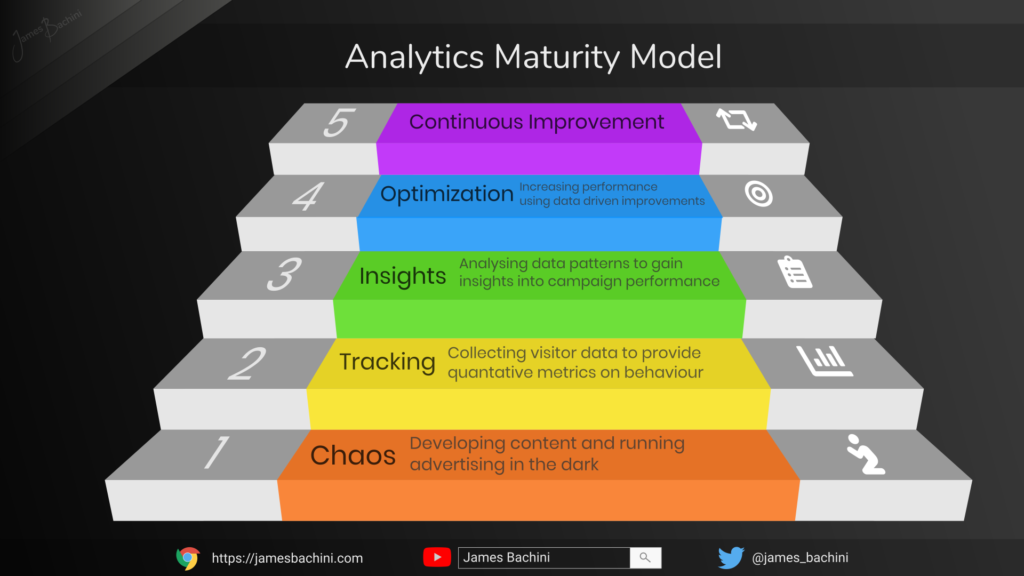
- Chaos – At the start there is no information or data to work with so development of the website or advertising campaign must be done blind. Developers will make design decisions based on previous experience and presumptions about the audience.
- Tracking – The next step on the ladder is to set up tracking and start recording visitor behavior. At this stage data collection may be broad rather than focused on specific conversion events.
- Insights – The data gained in the previous step can provide insights to improve the performance of the marketing efforts. Data analysis will give insights into what is working and what isn’t.
- Optimization – At this stage KPI’s such as “add to cart”, “lead”, “sale” are clearly identified and tracked through conversion pixels and goals. Conversion rate optimization (CRO) enables detailed information that enables developers to improve the performance of the entire sales funnel.
- Continuous Improvement – There is no perfect campaign and ultimately what marketers strive for is continuous improvement of their campaigns. By constantly moving forwards performance marketers are able to stay ahead of their peers and run ever more effective marketing campaigns.
Google is the market leader in this field with their trio of platforms Google Analytics, Tag Manager & Data Studio. While alternatives do exist this software is extremely powerful and adaptable to most marketing situations. Having said that for high performance direct response campaigns I still believe in collecting raw data internally and analyzing it manually.
5 Important Analytics Insights
These data points can be found in Google Analytics and other tracking platforms.

- Conversions By Traffic Source – Navigate to “Acquisition > All Traffic > Source/Medium”. This report will tell us exactly where the most valuable traffic is coming from. It allows marketers to double down on the most effective traffic sources that are driving volume that converts.
- Exit Page – Found in “Behavior > Site Content > Exit Pages”. Many marketers spend a lot of time on incoming traffic analysis but not enough time on where, when and why visitors are leaving the site. On a multi-page site we can run a exit page report to see where visitors are leaving. On a long form single page lander it’s possible to fire goals/pixels on scroll down to each section to get insights into where visitors are dropping off.
- Location – “Audience > Geo > Location” Breaking down traffic by geolocation can provide metrics into not only where visitors are coming from but which regions are underserved. I had a soccer website which for some reason was growing rapidly in Kenya but not the UK. After some research I found out there’s a lottery type football pools thing there called SportsPesa which was creating demand for the specific niche of football predictions.
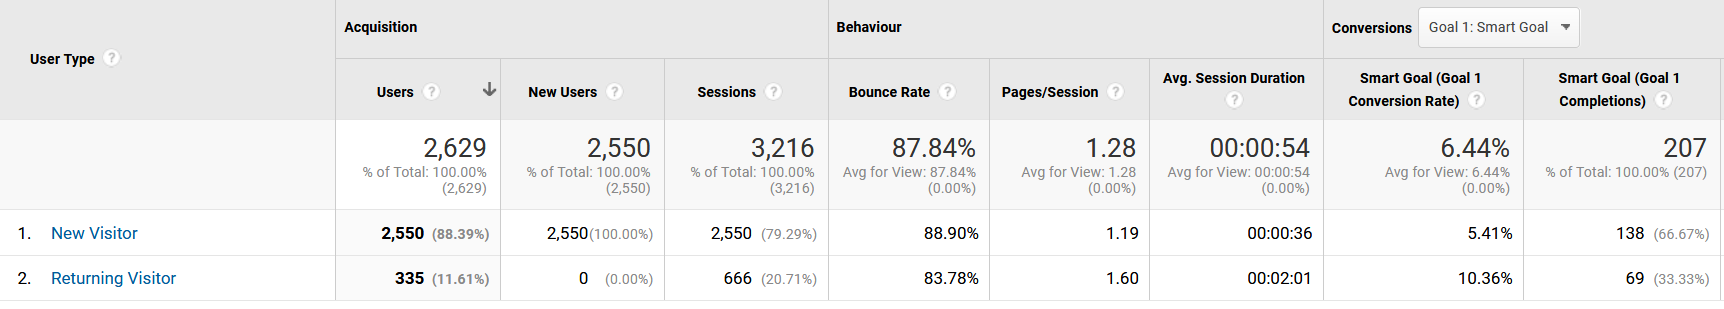
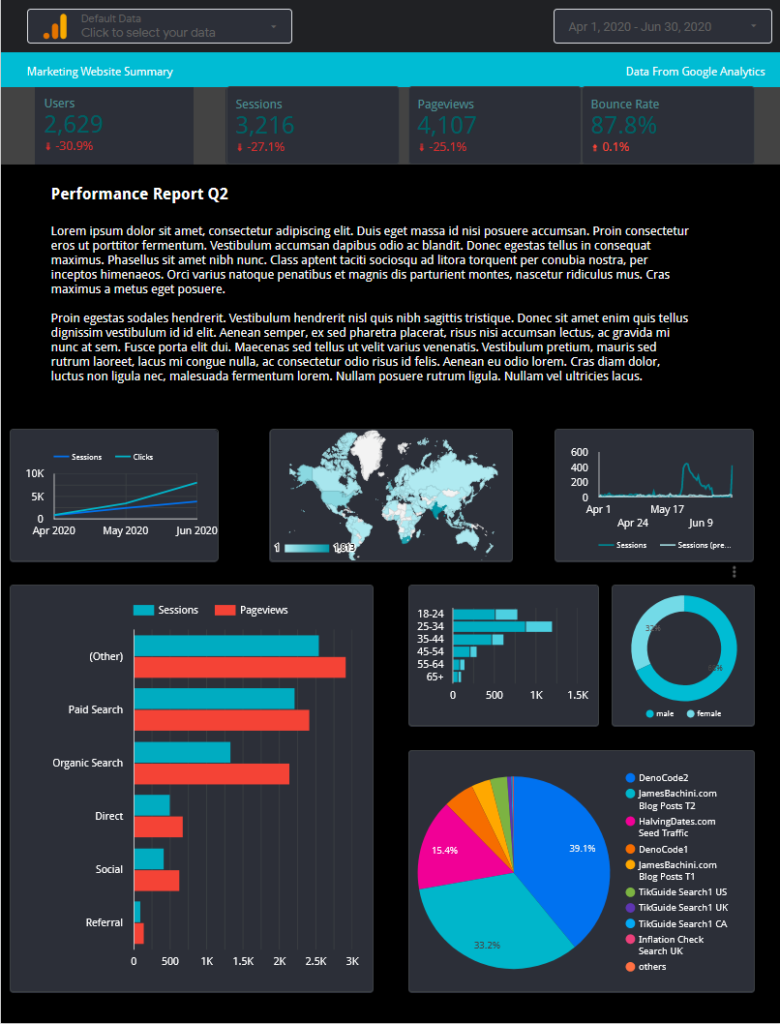
These types of insights can help content creators focus their efforts on what their audience wants. - New vs Returning Visitors – Can be found in “Audience > Behavior > New vs Returning”. This gives some indication as to how many visitors are coming back to your site. Normally repeat visitors convert better as they are already “warmed up” to the offer.

In the example above we can see that 11% of our users brought in 33% of the goal completions and those were returning visitors.
The cohort analysis report breaks this down further by showing how many visitors returned by specific time periods of days or weeks. - Mobile Devices – This report in “Audience > Mobile > Devices” when run with enough data can show up problems with certain mobile devices. For example if you notice that the conversion rate on many iPad devices is lower than standard it’s worth checking the site layout and user experience on those devices.
Googles Analytics & Data Tools
Google has a dominating market position for analytics and tracking tools. Google analytics is live on the majority of sites across the web.
The Google 360 marketing platform contains everything needed to track and optimize performance marketing campaigns at enterprise level. It also costs $150k/year, fortunately there are free versions for these tools which are ideally suited to independent marketers and SME’s.
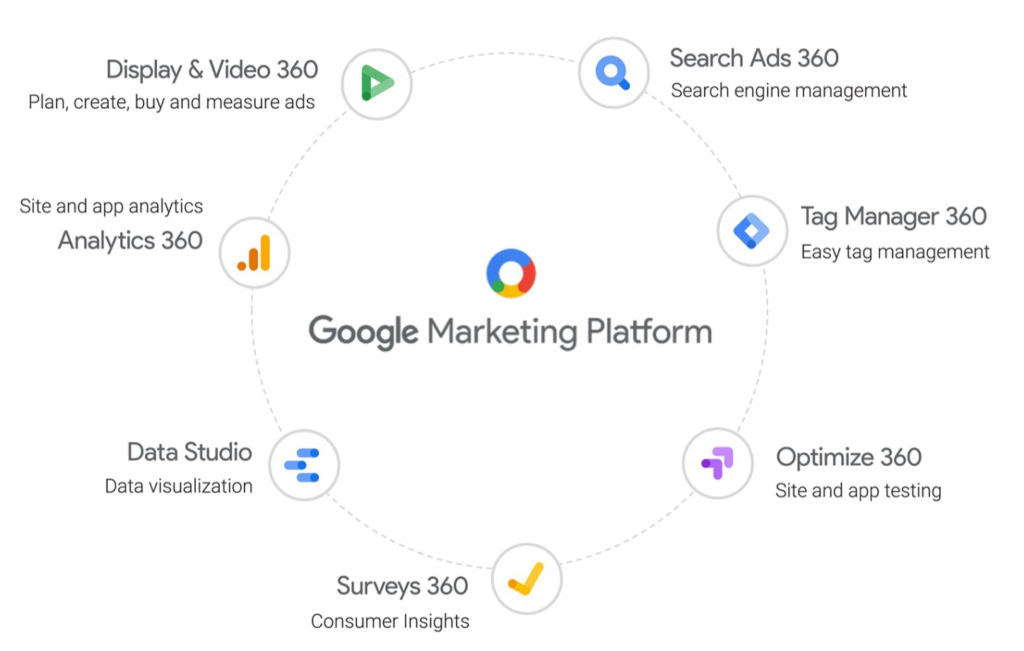
There are some limitations to the free versions, once you start approaching the 10 million / month impression cap in Google Analytics you’ll start getting warnings at which point you need to restrict it to one impression per user. This gets moved up to a billion impressions for the paid version.
The quartet of Google Analytics, Tag Manager, Data Studio and Optimize should be a part of every marketers war chest.
Let’s first look at the most popular platform Google Analytics.
Setting Up Google Analytics
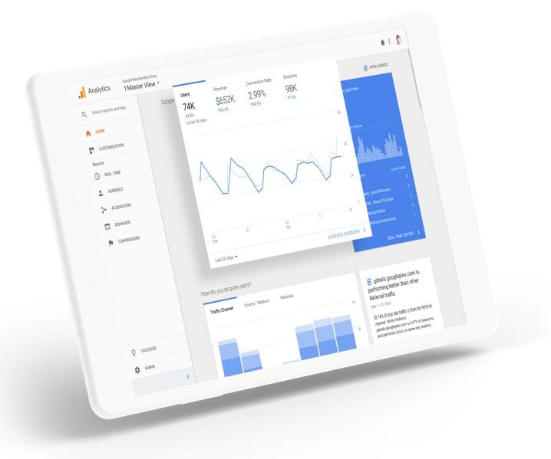
Google analytics is a free tool provided by Google to track website and app visitor metrics.
Basic Google Analytics Setup
To setup an account go to: https://analytics.google.com
Then go to “Settings” and “Create Property”
Fill in a short form:
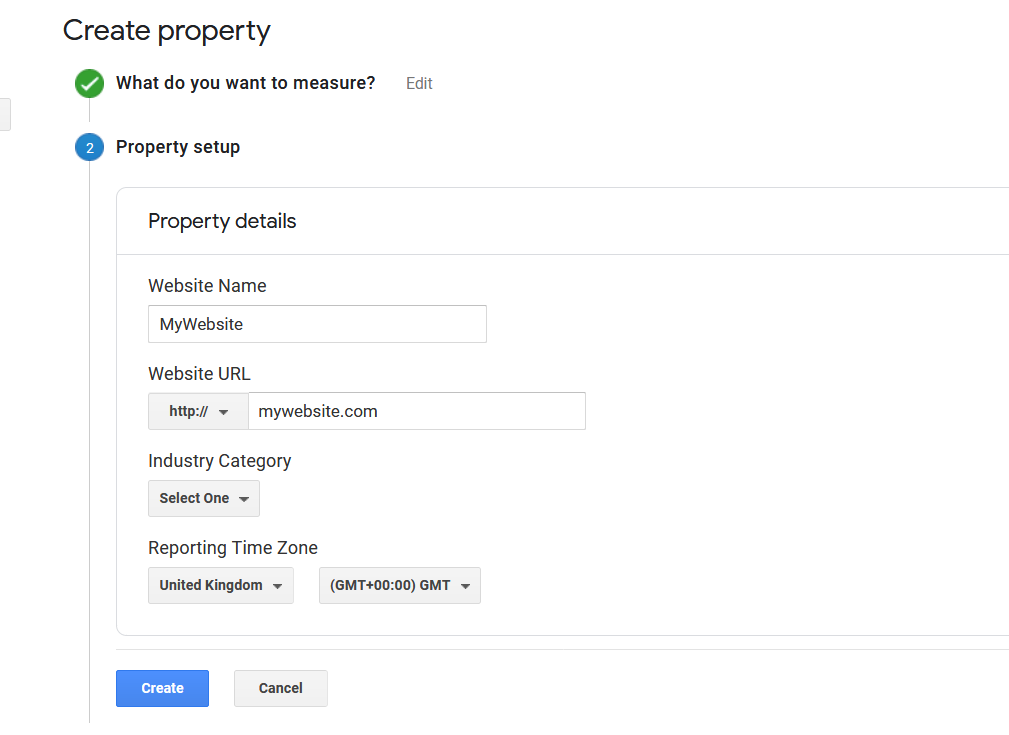
Then you’ll end up with some code and a tracking ID.
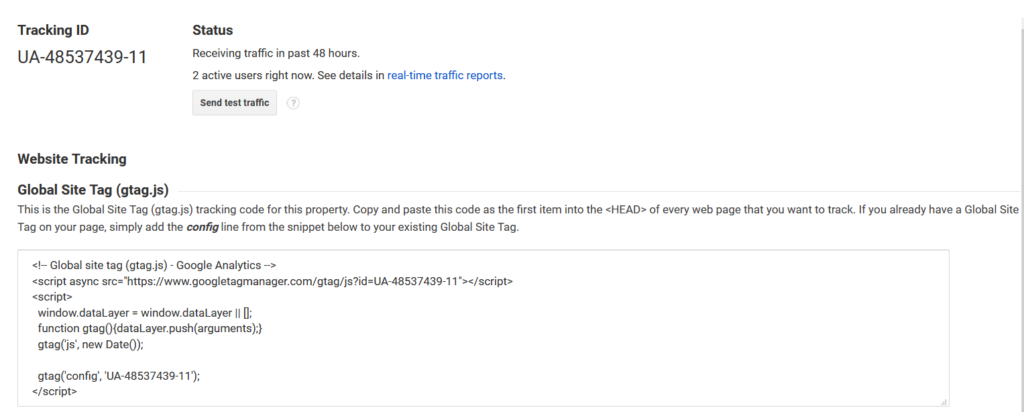
If using WordPress this tracking ID can be copied and pasted into any of the Google Analytics plugins.
For other sites either use Google Tag Manager or copy and paste the Global Site Tag on to the header of the site template so it loads on every page.
Advanced Google Analytics Setup
There’s some additional steps now to get the analytics configured correctly for performance marketing.
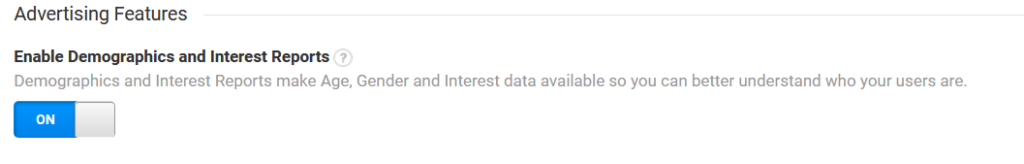
Go into property settings and turn on demographics reporting:
Then turn on remarketing and advertising reporting in “Tracking info > data collection”
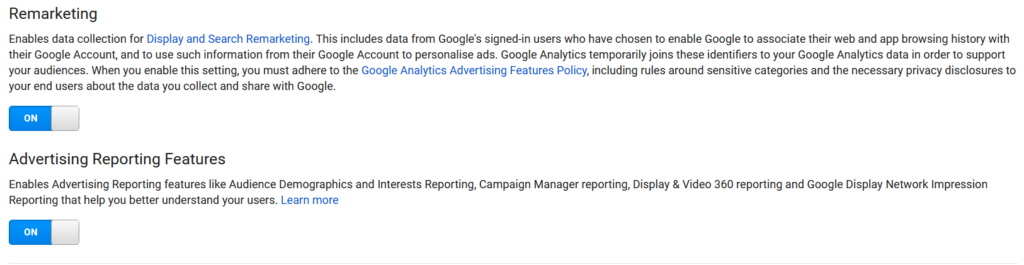
Make sure you click save at the bottom of the page after making changes to these settings.
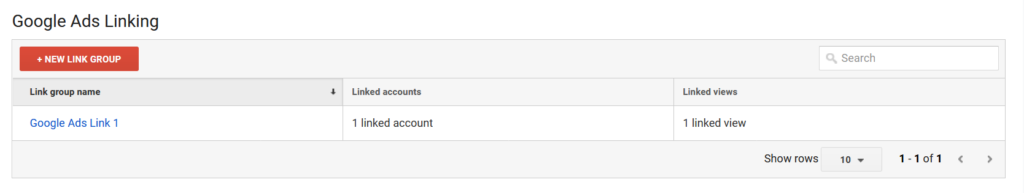
Then in “Product Linking > Google Ads” we want to link our Google Ads account to this analytics property.
Then go into “Goals” and let’s set up some goals to get conversion data.
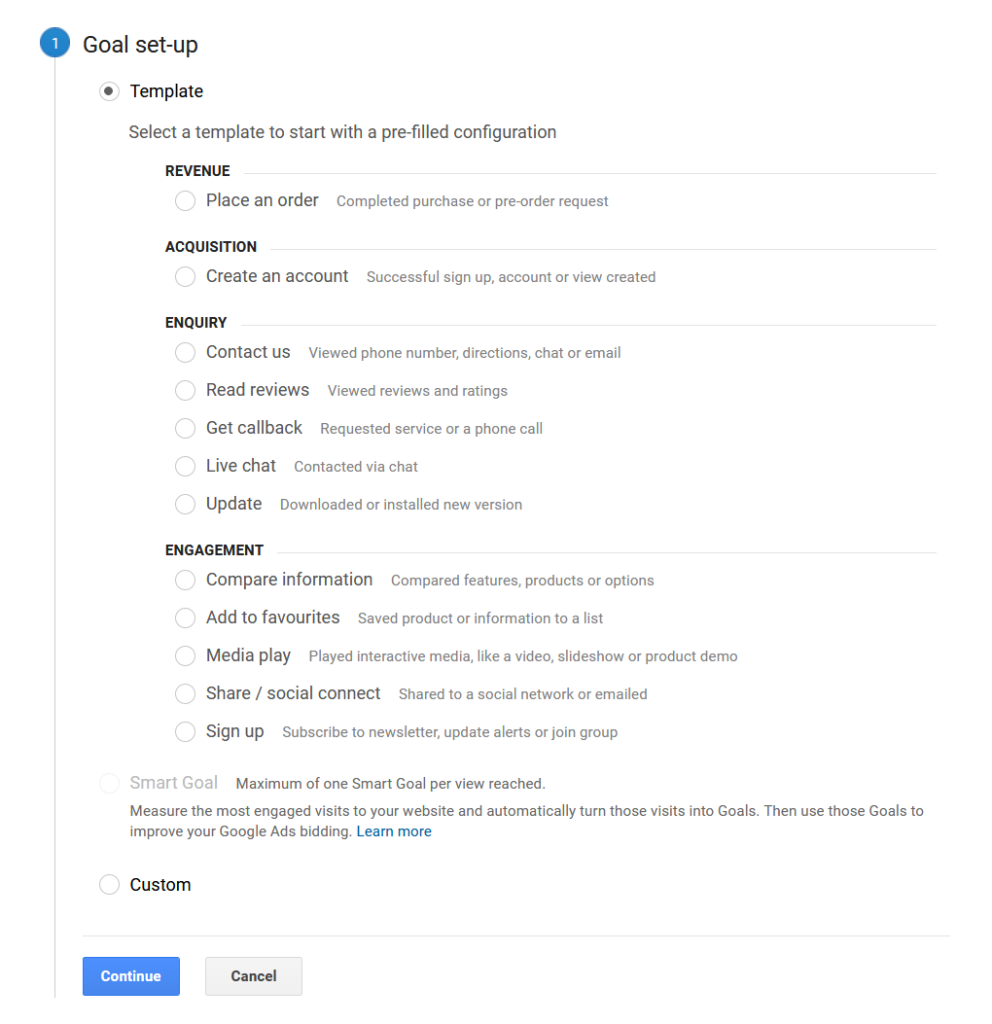
Ideally we want to set up as many goals, events and smart goals as possible based on micro conversions and key performance indicators.
Managing Pixels In Google Tag Manager
Google Tag Manager aims to simplify the management of multiple tracking pixels across different advertising and analytics networks.
It loads asynchronously before loading individual pixels providing site speed benefits as it isn’t holding up the main thread.
The first step to get started is to setup a container.
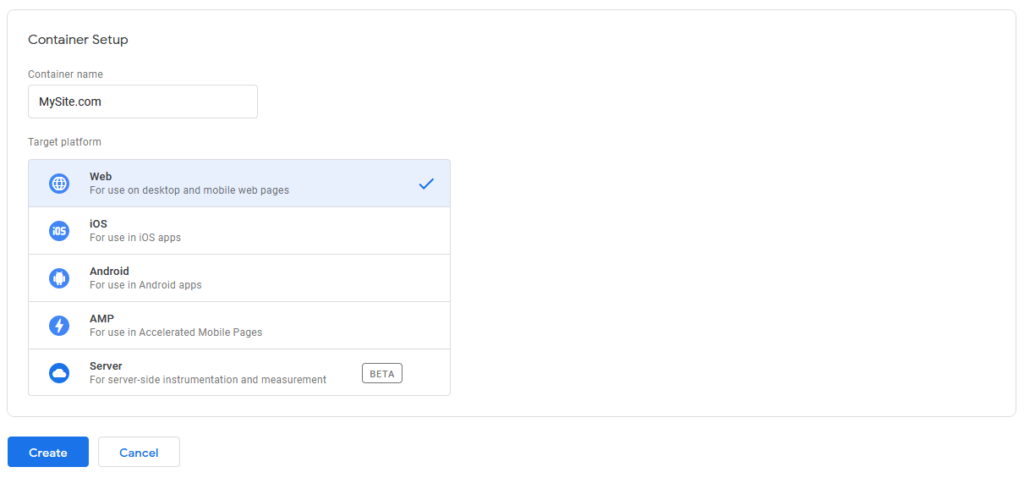
Then we install the code into the head of the document replacing any other tracking code on the site.
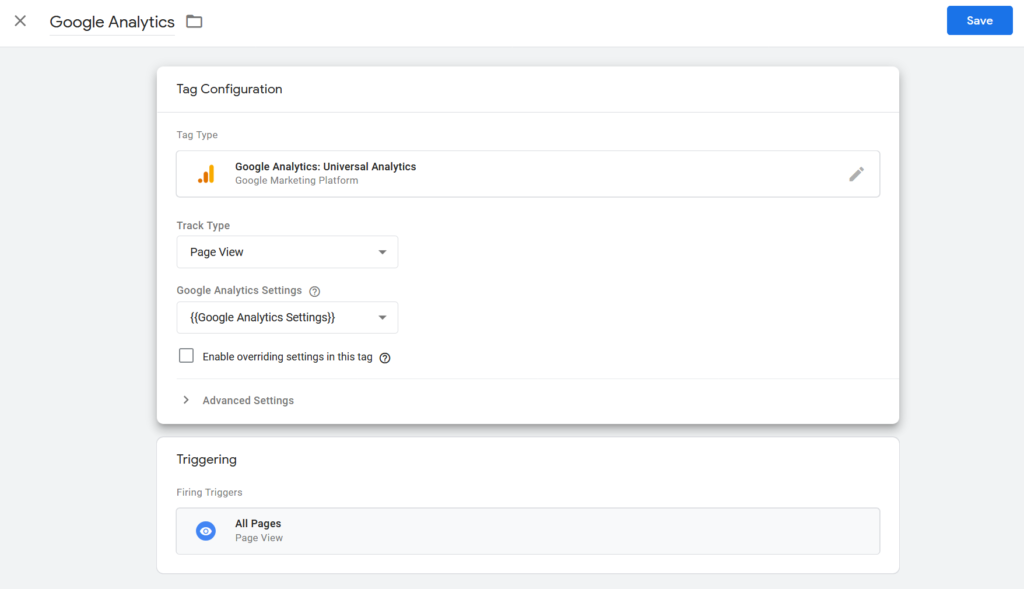
We can then add individual “tags” (pixels) which will be loaded in parallel based on the triggering conditions.
Google Tag Manager has automatic integrations for the following platforms:
- Google Analytics
- Google Marketing Platform
- Google Ads
- Google Ads Remarketing
- Floodlight Counter
- Floodlight Sales
- Conversion Linker
- Google Optimize
- Google Surveys
- Custom
- Custom HTML
- Custom HTML Tag
- Custom Image
- Custom Image Tag
- AB TASTY
- Adometry
- AdRoll
- Audience Center 360
- AWIN
- Bizrate Insights
- ClickTale
- comScore
- Crazy Egg
- Criteo
- DistroScale
- Dstillery
- Eulerian Analytics
- FoxMetrics
- Google Flights
- Google Trusted Stores
- Hotjar
- Infinity Tracking
- K50
- LeadLab
- Lytics
- Marin Software
- Mediaplex
- Microsoft Bing Ads
- Mouseflow
- AdAdvisor
- Neustar
- DCR Static
- Nielsen
- Nudge Analytics
- Oktopost
- Optimise Media
- Message Mate
- OwnerListens
- Perfect Audience
- Personali
- Placed
- Pulse Insights
- Quantcast
- Quora
- SaleCycle
- SearchForce
- Shareaholic
- Survicate
- Tapad
- Tradedoubler
- Turn
- Upsellit.com
- Ve Interactive
- VisualDNA
- Xtremepush
- Yieldify
One useful feature of GTM is that it has built-in and customisable variables which can be used across containers and triggers.
Triggers can be used to fire certain pixels for certain events or goals such as conversion pixels.
- Page View
- DOM Ready
- Window Loaded
- Click
- Element Visibility
- Form Submission
- Scroll Depth
- YouTube Video
- Custom Event
- History Change
- JavaScript Error
- Timer
We can also combine multiple triggers into trigger groups to fire on multiple behaviors.
For developers a lot of this will seem rudimentary but for teams and non-technical personnel Google Tag Manager can make some of the complex aspects of tracking and analytics more accessible.
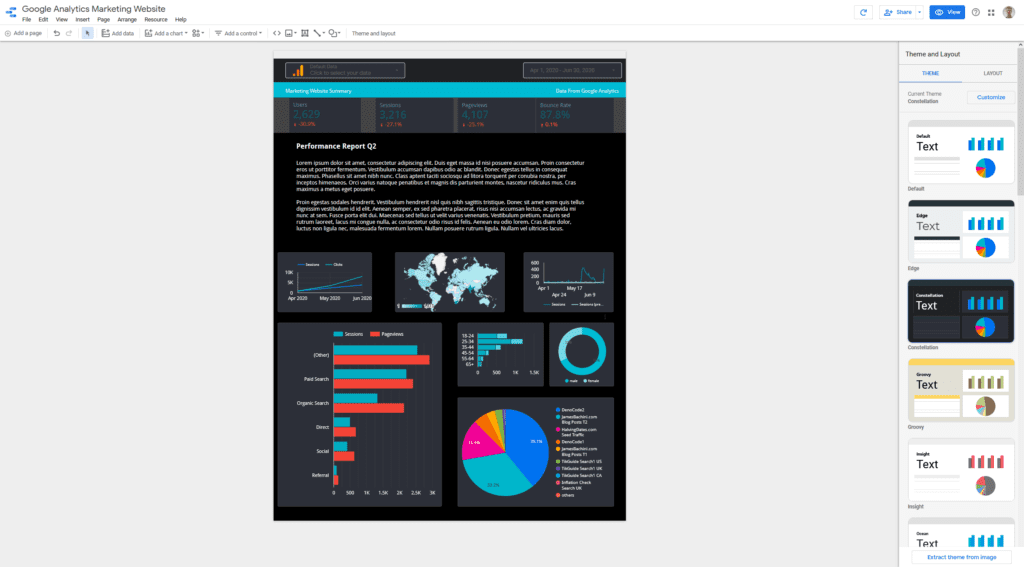
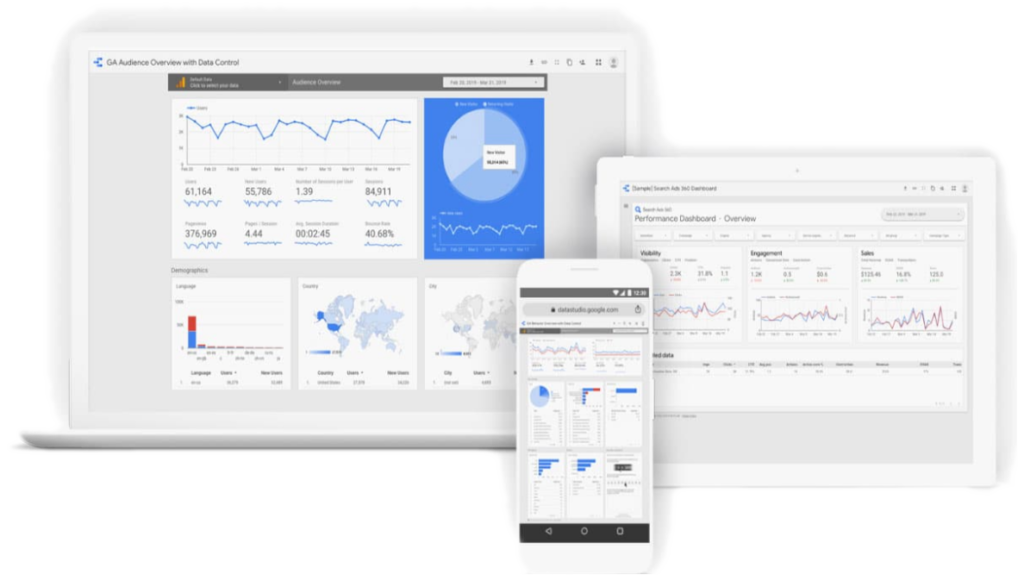
Analyzing Data In Google Data Studio
Google Data Studio is about as close to fun as it gets for tracking and analytics. It’s a really great drag and drop platform where you can pull in data and present it in web based Google Docs reports.
Here are some of the Google managed data sources:
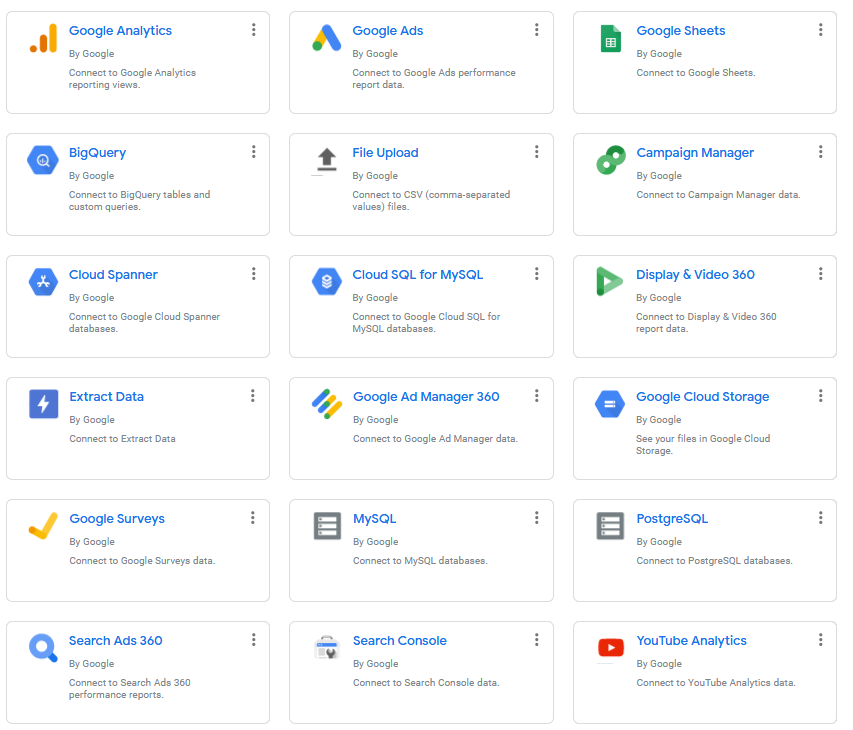
At time of writing there’s also 235 3rd party data sources that can be integrated at the click of a button.
Once you have the data sources connected we can drag charts, tables and scorecards on to the report.
Controls can be added so once in the report you can change dates and explore the data visualizations.
Reports can be shared with a team in the same way as other Google Docs.
Alternatives To The Google Tools
Google’s suite of data analytics tools are unmatched but here are some alternatives which are useful in certain situations.
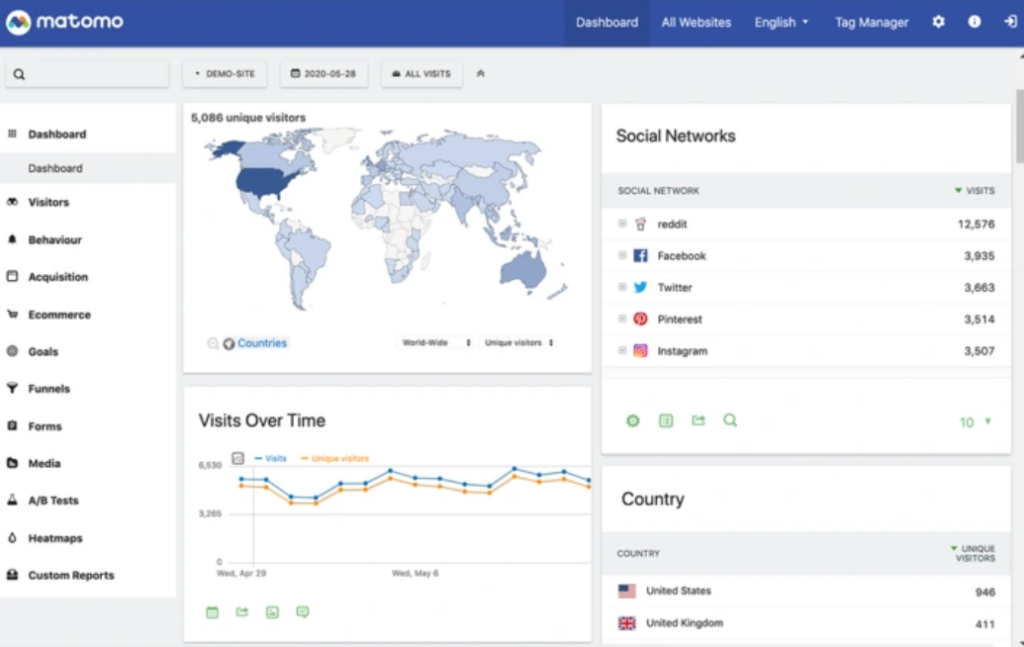
Matomo (Piwik)
Originally this project was known as Piwik that then got split into:
This is very similar to Google Analytics with the main feature being it stores data on the local web server away from Google.
Voluum
Voluum is a paid tracking platform SaaS. It’s more designed for affiliate marketing rather than website analytics.
HotJar
This is heatmap and session recording software which can be used as an alternative or to compliment Google analytics. It’s useful for improving user experience and gaining insights for CRO.

Internal Data Analytics
For high volume performance campaigns it can be a good idea to record data and analyze it in-house.
Any database can be used although something that is fast at doing numerical additions will work best. Reddis and MongoDB are good options but whatever you are using for the rest of the site will likely work fine.
Alternatively a simple NodeJS microservice storing data in RAM and writing out periodically to JSON works well and separates the tracking data and logic.
In it’s simplest form conversions and events are used as data points which get a +1 each time they are completed.
200823: {
  uniques: 100,
  impressions: 225,
  scrolls: 56,
  click: 20,
  checkout: 10,
  sales: 3,
}
From this it’s easy to start adapting the custom tracking to meet the needs of the campaign or website.
Data can be analyzed by exporting the data as JSON or CSV files and then writing scripts in Python or Node to compile it. Data visualization tools like Tableau can help make it look pretty for presentations.
This data is also very easy to pull into tracking and admin dashboards to make KPI metrics visual to the team.
Conversion Tracking & Optimization (CRO)
There is a whole module on conversion rate optimization here so I wont dive to much into it.
https://jamesbachini.com/cro-conversion-rate-optimisation/
Basically we should be optimizing our landing pages constantly by tracking conversions and doing A/B or MV tests.
Collecting data internally is great for this however Google does have a tool as well called Google Optimize.
It’s possible to carry out simple testing in Google Analytics as well using events or separate landing pages as different files.
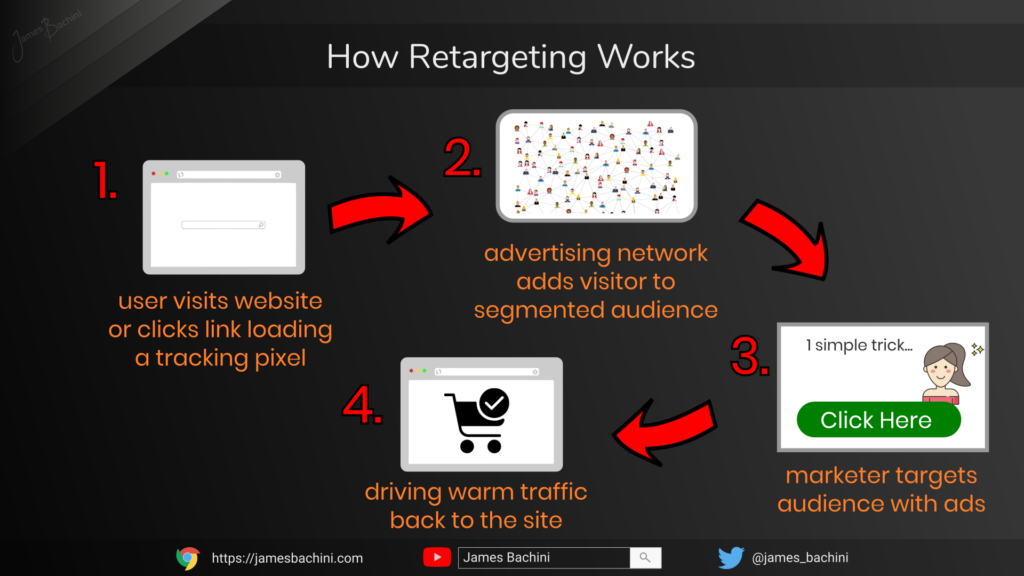
Retargeting & Audience Pixels
Retargeting pixels allow marketers to run advertising campaigns targeting only people that have seen the pixel.
This allows us to segment audiences based on:-
- Visits to a site
- Abandoned carts
- Clicks from an email
- Real users rather than bot traffic
The last point is a key factor as to why retargeting campaigns work so well. It’s real genuine traffic from real users who are already familiar with your brand… warm traffic.
The main networks that should be setup from the start are Google Ads and Facebook Ads.
With these two networks alone we can target visitors across any websites/blogs that have Adsense, Youtube, Google search, Gmail, Facebook & Instagram. That’s a massive slice of the web.
If your brand is particularly active on a particular social media platform then it check if they have retargeting ads available and include their pixel. Twitter, Linkedin, Pinterest and Snapchat all have retargeting available on their internal ad platforms.
Qualitative Data Sources
The analytics strategy discussed so far has been mainly focused on quantitative stats. Qualitative data sources can provide great insights too and a single feedback form can change the way we think about the customer journey.
There are many ways to collect qualitative data such as:-
- Feedback Forms
- Polls
- Surveys
- Customer Outreach
- Bug Bounties
- UX Analysts
- Live Chat
- Exit Pops
- User Testing
Qualitative data is most valuable when it’s consumed directly by the team designing the website, app or conversion funnel.
It can provide insights that guide development of the campaign in a customer-centric manner.
Something like a simple floating feedback button is easy to setup and opens up communications with visitors.
Data Driven Marketing
Setting up good tracking and having a strong analytics strategy lays a solid foundation for data driven marketing.
Gaining insights into how visitors behave on our web properties enables marketers to continuously improve their campaigns and optimize for better performance.
Google Analytics is a good place to start but there is much more to it as we’ve seen in this article. Both quantitative and qualitative data can be used to make data driven decisions when optimizing campaigns.
Tracking the data is the first step on the ladder of the analytics maturity model. Getting this data and insights derived from it to the developers and marketers is essential to utilizing it for improved performance.

Track the data, gain insights from analysis, test variations based on insights and continuously improve the UX and conversion rate.
This article is part of a free online course where you can learn digital marketing.
If you’ve enjoyed these resources could you help share this content on social media and send it to anyone who you think might benefit from it.
Thank you.