
This single index.html file can be uploaded to any web server, run locally, or accessed here:
https://jamesbachini.com/misc/browser-resources.html
It enables web developers to monitor browser resources over time and test different devices processing abilities.
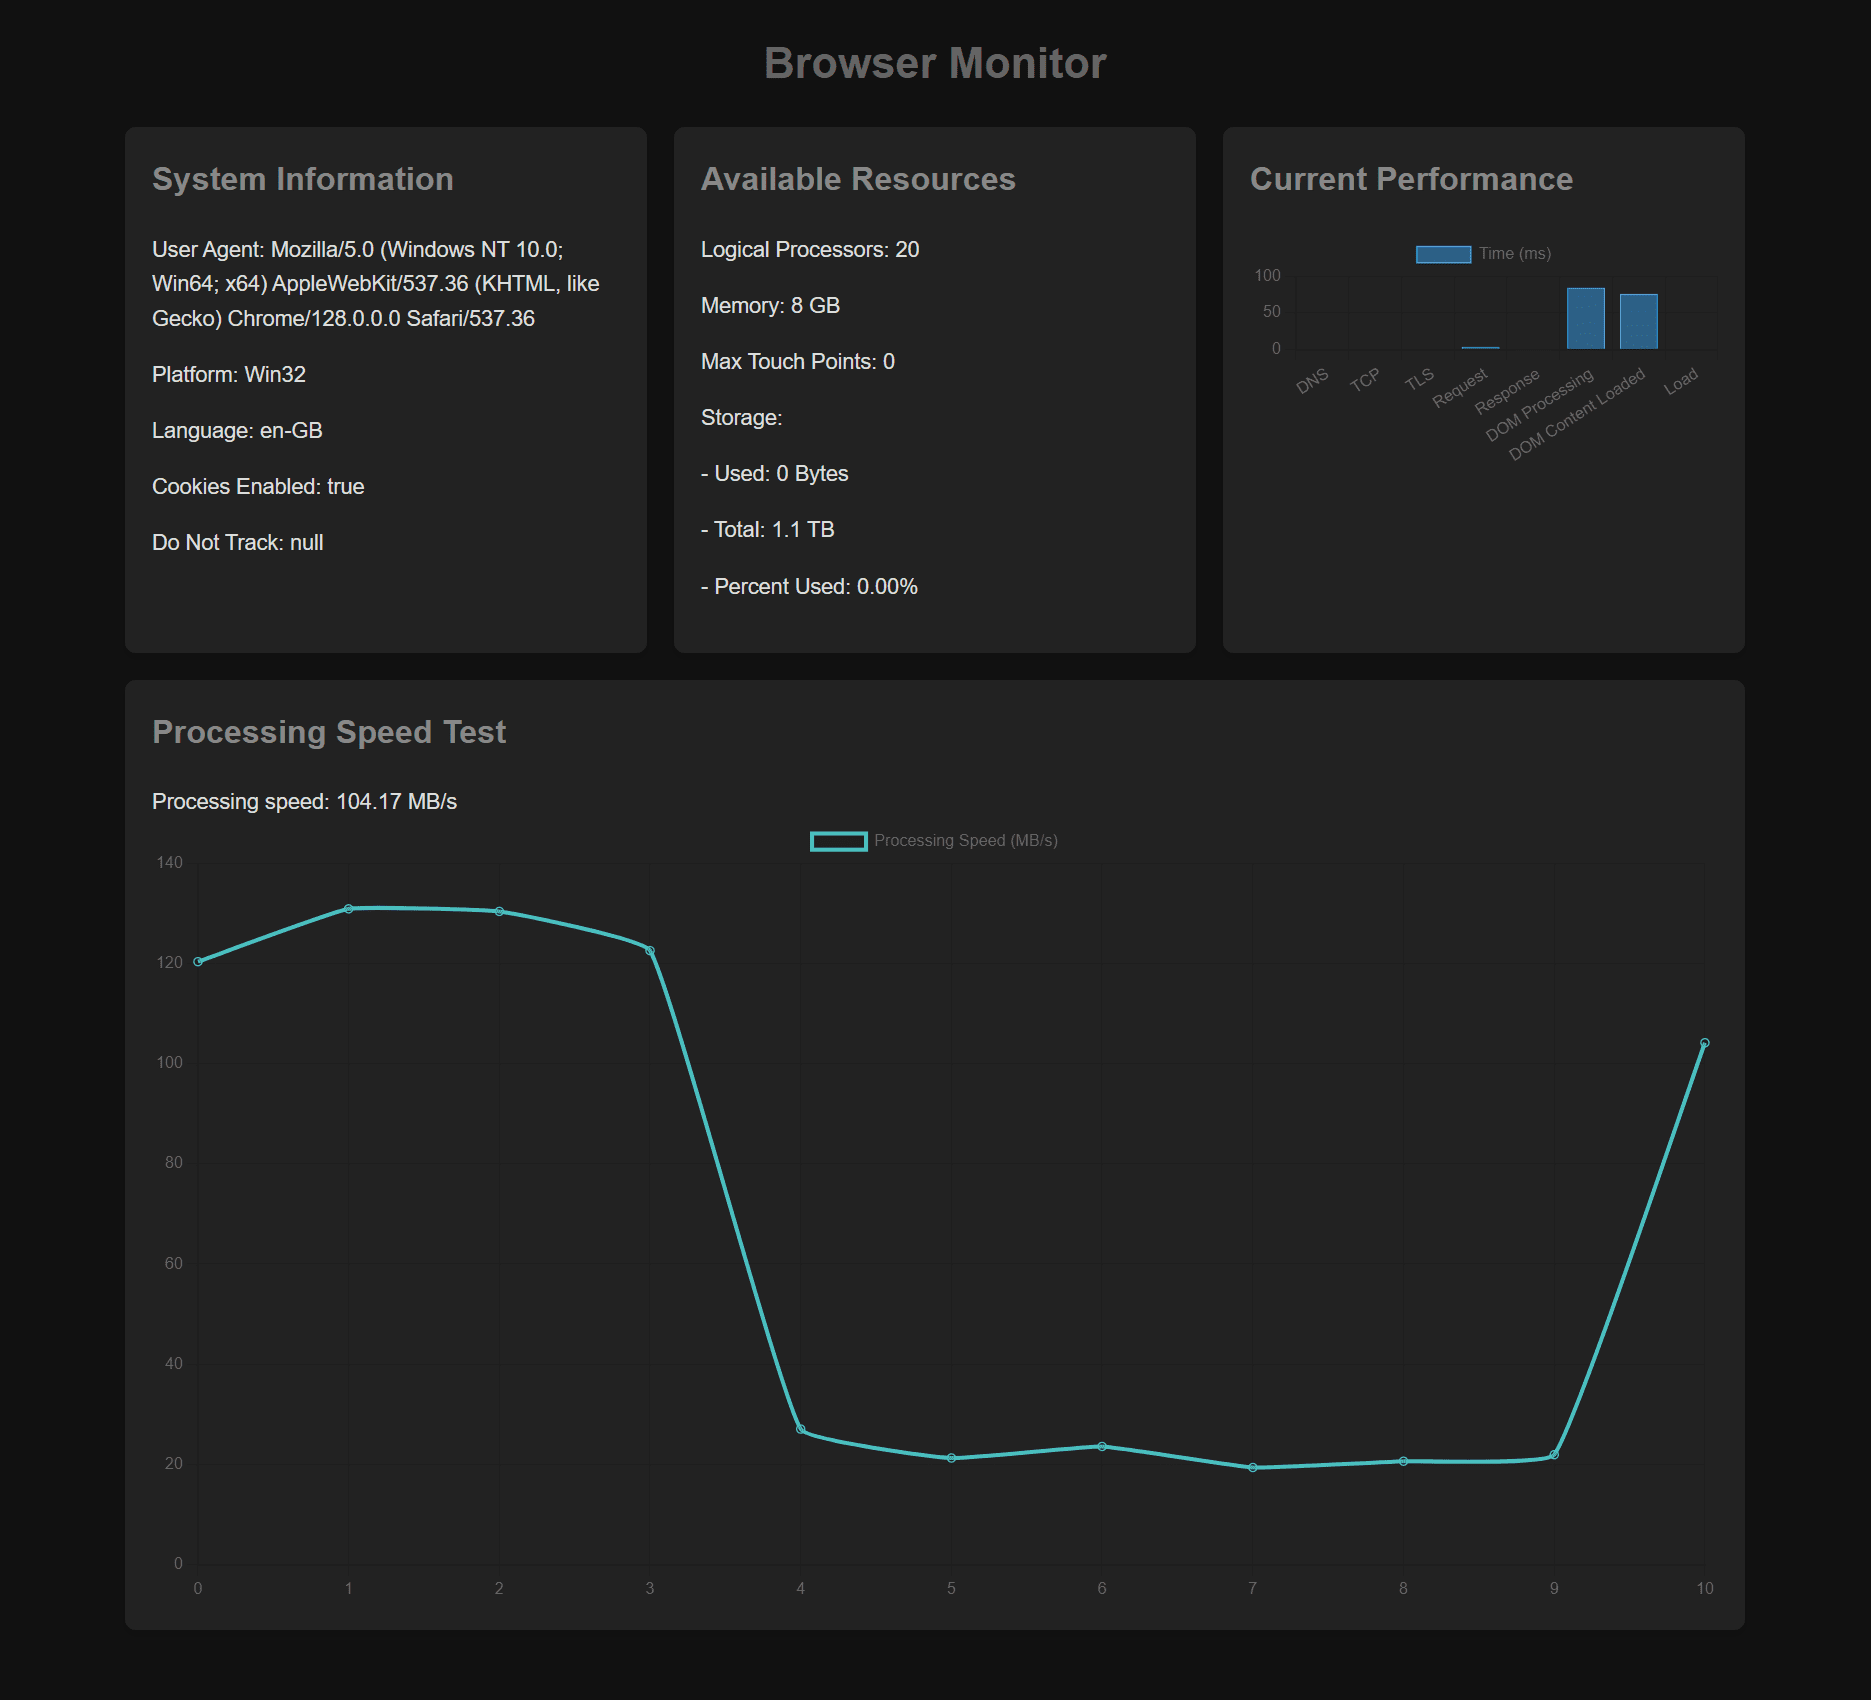
The dashboard first collects and presents fundamental system information, providing context about the environment in which the application operates. This data includes:
- User Agent Provides information about the browser and operating system being used.
- Platform Displays the computer’s operating system.
- Language Shows the browser’s primary language setting.
- Hardware Details Includes the number of logical processors and available memory.
- Storage Information Shows the used and available storage space.
This data is pulled using properties of the navigator object and the Web Storage API. Having access to this system information helps developers understand the client environment, allowing them to optimize their application’s performance accordingly.
Using the Performance API, the dashboard tracks and displays detailed timing information related to page load performance. Key stages captured include:
- DNS Lookup Time spent resolving the domain name.
- TCP Connection Time to establish the connection to the server.
- TLS Negotiation Time required to establish a secure connection (if applicable).
- Request and Response Times Time taken to send a request and receive a response from the server.
- DOM Processing Time taken for the browser to process the HTML document and build the DOM.
- DOM Content Loaded Event Time at which the DOM is fully loaded, but external resources like stylesheets or images may not yet be loaded.
- Load Event Time at which the entire page (including external resources) is fully loaded.
These performance metrics are displayed in a bar chart, offering a quick visual reference to identify areas where loading delays occur. Developers can use this information to diagnose bottlenecks and optimize loading times.
To provide insight into the browsers processing capabilities, the dashboard includes a speed test. This test simulates a data-heavy operation and measures how quickly the browser can process a large chunk of data. The test works by:
- Generating a large
ArrayBuffer(10MB) filled with random data. - Creating a
Blobobject from this data. - Reading the
Blobback into memory using aFileReader. - Measuring the time it takes for this entire process to complete.
The outcome is reported as a processing speed in MB/s. This result helps developers gauge the browser’s ability to handle large datasets or complex computations. For applications dealing with big data or media processing, this metric can offer valuable insights into the browser’s performance capabilities.
Browser Resource Monitor Code
Full code is on Github at: https://github.com/jamesbachini/Browser-Benchmark-Tests
<!DOCTYPE html>
<html lang="en">
<head>
    <meta charset="UTF-8">
    <meta name="viewport" content="width=device-width, initial-scale=1.0">
    <title>Browser Monitor</title>
    <script src="https://cdnjs.cloudflare.com/ajax/libs/Chart.js/3.7.0/chart.min.js"></script>
    <style>
        body {
            font-family: Arial, sans-serif;
            line-height: 1.6;
            color: #DDD;
            max-width: 1200px;
            margin: 0 auto;
            padding: 20px;
            background-color: #111;
        }
        h1 {
            color: #666;
            text-align: center;
        }
        a {
            color: #888;
            text-decoration: none;
        }
        .dashboard {
            display: grid;
            grid-template-columns: repeat(auto-fit, minmax(300px, 1fr));
            gap: 20px;
            margin-top: 20px;
        }
        .card {
            background-color: #222;
            border-radius: 8px;
            box-shadow: 0 4px 6px rgba(0, 0, 0, 0.1);
            padding: 20px;
            transition: transform 0.3s ease;
        }
        .card:hover {
            transform: translateY(-5px);
        }
        .card h2 {
            color: #888;
            margin-top: 0;
        }
        canvas {
            max-width: 100%;
            height: auto;
        }
        #performanceOverTime {
            grid-column: 1 / -1;
        }
    </style>
</head>
<body>
    <h1>Browser Monitor</h1>
    <div class="dashboard">
        <div class="card">
            <h2>System Information</h2>
            <div id="systemInfo"></div>
        </div>
        <div class="card">
            <h2>Available Resources</h2>
            <div id="resources"></div>
        </div>
        <div class="card">
            <h2>Current Performance</h2>
            <canvas id="currentPerformanceChart"></canvas>
        </div>
        <div class="card" id="performanceOverTime">
            <h2>Processing Speed Test</h2>
            <div id="speedTestResult"></div>
            <canvas id="performanceOverTimeChart"></canvas>
        </div>
    </div>
    <div>
        <a href="https://jamesbachini.com/browser-resource-monitor/">https://jamesbachini.com/browser-resource-monitor/</a>
    </div>

    <script>
        let performanceData = [];
        let currentPerformanceChart;
        let performanceOverTimeChart;

        function getSystemInfo() {
            const systemInfo = document.getElementById('systemInfo');
            systemInfo.innerHTML = `
                <p>User Agent: ${navigator.userAgent}</p>
                <p>Platform: ${navigator.platform}</p>
                <p>Language: ${navigator.language}</p>
                <p>Cookies Enabled: ${navigator.cookieEnabled}</p>
                <p>Do Not Track: ${navigator.doNotTrack}</p>
            `;
        }

        function getResources() {
            const resources = document.getElementById('resources');
            resources.innerHTML = `
                <p>Logical Processors: ${navigator.hardwareConcurrency}</p>
                <p>Memory: ${navigator.deviceMemory ? navigator.deviceMemory + ' GB' : 'Not available'}</p>
                <p>Max Touch Points: ${navigator.maxTouchPoints}</p>
            `;

            if (navigator.storage && navigator.storage.estimate) {
                navigator.storage.estimate().then(estimate => {
                    const percentUsed = ((estimate.usage / estimate.quota) * 100).toFixed(2);
                    resources.innerHTML += `
                        <p>Storage:</p>
                        <p>- Used: ${formatBytes(estimate.usage)}</p>
                        <p>- Total: ${formatBytes(estimate.quota)}</p>
                        <p>- Percent Used: ${percentUsed}%</p>
                    `;
                });
            }
        }

        function getCurrentPerformance() {
            const perfEntries = performance.getEntriesByType('navigation')[0];
            return [
                perfEntries.domainLookupEnd - perfEntries.domainLookupStart,
                perfEntries.connectEnd - perfEntries.connectStart,
                perfEntries.secureConnectionStart ? perfEntries.connectEnd - perfEntries.secureConnectionStart : 0,
                perfEntries.responseStart - perfEntries.requestStart,
                perfEntries.responseEnd - perfEntries.responseStart,
                perfEntries.domInteractive - perfEntries.responseEnd,
                perfEntries.domContentLoadedEventEnd - perfEntries.domContentLoadedEventStart,
                perfEntries.loadEventEnd - perfEntries.loadEventStart
            ];
        }

        function updateCurrentPerformanceChart(data) {
            const canvas = document.getElementById('currentPerformanceChart');
            const ctx = canvas.getContext('2d');

            if (currentPerformanceChart) {
                currentPerformanceChart.data.datasets[0].data = data;
                currentPerformanceChart.update();
            } else {
                currentPerformanceChart = new Chart(ctx, {
                    type: 'bar',
                    data: {
                        labels: ['DNS', 'TCP', 'TLS', 'Request', 'Response', 'DOM Processing', 'DOM Content Loaded', 'Load'],
                        datasets: [{
                            label: 'Time (ms)',
                            data: data,
                            backgroundColor: 'rgba(54, 162, 235, 0.5)',
                            borderColor: 'rgba(54, 162, 235, 1)',
                            borderWidth: 1
                        }]
                    },
                    options: {
                        responsive: true,
                        scales: {
                            y: {
                                beginAtZero: true
                            }
                        }
                    }
                });
            }
        }

        function runSpeedTest() {
            return new Promise((resolve) => {
                const startTime = performance.now();
                const testSize = 10 * 1024 * 1024;
                const testData = new ArrayBuffer(testSize);
                const view = new Uint8Array(testData);
                for (let i = 0; i < testSize; i++) {
                    view[i] = Math.floor(Math.random() * 256);
                }

                const blob = new Blob([testData]);
                const reader = new FileReader();

                reader.onload = function() {
                    const endTime = performance.now();
                    const durationInSeconds = (endTime - startTime) / 1000;
                    const speedMBps = (testSize / (1024 * 1024) / durationInSeconds).toFixed(2);
                    resolve(parseFloat(speedMBps));
                };

                reader.onerror = function() {
                    console.error('Speed test error');
                    resolve(0);
                };

                reader.readAsArrayBuffer(blob);
            });
        }

        function updateSpeedTestResult(speed) {
            const result = document.getElementById('speedTestResult');
            result.textContent = `Processing speed: ${speed.toFixed(2)} MB/s`;
        }

        function updatePerformanceOverTimeChart() {
            const canvas = document.getElementById('performanceOverTimeChart');
            const ctx = canvas.getContext('2d');

            if (performanceOverTimeChart) {
                performanceOverTimeChart.data.labels = performanceData.map((_, index) => index);
                performanceOverTimeChart.data.datasets[0].data = performanceData;
                performanceOverTimeChart.update();
            } else {
                performanceOverTimeChart = new Chart(ctx, {
                    type: 'line',
                    data: {
                        labels: performanceData.map((_, index) => index),
                        datasets: [{
                            label: 'Processing Speed (MB/s)',
                            data: performanceData,
                            borderColor: 'rgba(75, 192, 192, 1)',
                            tension: 0.1
                        }]
                    },
                    options: {
                        responsive: true,
                        scales: {
                            y: {
                                beginAtZero: true
                            }
                        }
                    }
                });
            }
        }

        function formatBytes(bytes, decimals = 2) {
            if (bytes === 0) return '0 Bytes';
            const k = 1024;
            const dm = decimals < 0 ? 0 : decimals;
            const sizes = ['Bytes', 'KB', 'MB', 'GB', 'TB', 'PB', 'EB', 'ZB', 'YB'];
            const i = Math.floor(Math.log(bytes) / Math.log(k));
            return parseFloat((bytes / Math.pow(k, i)).toFixed(dm)) + ' ' + sizes[i];
        }

        async function updateDashboard() {
            getSystemInfo();
            getResources();
            updateCurrentPerformanceChart(getCurrentPerformance());
            const speed = await runSpeedTest();
            updateSpeedTestResult(speed);
            performanceData.push(speed);
            if (performanceData.length > 20) {
                performanceData.shift();
            }
            updatePerformanceOverTimeChart();
        }

        document.addEventListener('DOMContentLoaded', function() {
            updateDashboard();
            setInterval(updateDashboard, 5000);
        });
    </script>
</body>
</html>
