
Growth metrics have been used by tech VC’s for years to predict and monitor companies growth patterns. Terms like CAC (Customer acquisition cost) and LTV (Lifetime value) are critical to how we value startups in the traditional space. In DeFi the landscape is different and the metrics that we use are too. However on-chain transparency makes it easier than ever to gain alpha through better understanding and assessment of these DeFi growth metrics.
- TVL – Total Value Locked
- Active Wallet Addresses
- Transaction Volume
- Fee Revenue Generated
- Token Appreciation

TVL – Total Value Locked
Total value locked is the digital asset value held within a protocols smart contracts.
For example a decentralised exchange will hold funds in the form of liquidity pools which will receive capital inflows from investors. Traders can then trade one asset for another from these liquidity pools. The protocol TVL includes the total amount held within these liquidity pools.
TVL is rarely protocol owned funds and is more often staked users funds and the protocol is acting as a custodian and offering returns or yield in the form of fees or governance tokens to encourage investors to deposit funds.
TVL can be manipulated through growth incentives. If a protocol offers 20% return on USDC even for a short amount of time then their TVL will go through the roof within hours. For this reason it’s critical to assess TVL with a wider framework of sustainability.
If governance tokens are being used to incentivise deposits how long will this go on for? Is the governance token likely to hold value or will it depreciate like many farm tokens do as it’s sold off to realise early gains.
If there is a liquidity incentive program is it sustainable? How likely is it that the fees or revenues will one day be able to support the TVL and future growth of the protocol?
We have seen alternate layer one ecosystems like AVAX receive hundreds of millions of dollars in liquidity incentives to bootstrap growth. This provides limited time opportunities for yield farmers and inflates the TVL across all affected DeFi protocols.
More recently we saw the launch of Solidly exchange which boosted TVL across the Fantom ecosystem through the unique distribution mechanism of it’s governance tokens. The sustainability of this TVL is somewhat questionable as yield farmers are a fickle bunch and part of the game is moving assets around to always find the next big thing.
One of my favourite websites for tracking TVL is DeFiLlama. It provides a breakdown of DeFi protocols, chains and categories in which products are ranked by their TVL. Equally useful for developers is that each protocol has a methodology section which shows how you can import that TVL directly from the protocol/blockchain into your own analysis systems.

Active Wallet Addresses
The next most widely used DeFi growth metric is active wallet addresses. This is again very easy to calculate as it’s an on-chain metric. We can use Etherscan or a custom web3 script to see how many wallets have interacted with a contract at a set address since it was deployed.
Here’s an example of a script that I open sourced to check various on-chain contract metrics.
https://github.com/jamesbachini/SCRAP-Smart-Contract-Rapid-Analysis-Platform

While this metric is easily gameable through the creation of multiple wallets it’s often a reliable indicator of protocol growth and narrative shifts.
The only exception to this is when there are airdrops involved. This will often create an influx of “Sybil Attacks” where users will bombard a protocol with lots of tiny transactions from thousands of wallets in an attempt to gain more from a potential future airdrop of governance tokens. In this case one wallet != one user.
Under normal market conditions however active wallet addresses provides a clean transparent metric of how users are interacting with the protocol.
We can take this a step further and break down new users from existing users and plot these on graphs. Ideally for growth investments we want to see the new user numbers accelerating in a traditional hockey stick pattern.
Transaction Volume
Transaction volume can be measured by the number of transactions or the value of those transactions. In most cases such as DEX valuation it will refer to the total USD value of transactions going through the exchange.
Note that on low fee alternate layer one’s these stats are easily and often manipulated. Wash trading is when a market maker executes trades against their own orders to simulate real trade volume.
Another way this is manipulated is through incentivised trading programs. At one point it was worth trading on DyDx even if your entry was a coin flip because the incentives were greater than any losses and fees. This type of program inevitably leads to higher than expected trading volumes which slow down as the incentives dry up.
Transaction volume can still be a useful metric for comparing different protocols or measuring growth between similar assets. Some simple due diligence can identify the protocols where this metric is valid and can be used to assess future growth.
Fee Revenue Generated
Fee revenues are one of my personal favourite metrics for assessing layer 1 and layer 2 blockchains. There’s a simple website at https://cryptofees.info which lists a number of projects with their daily and 7 day average fee revenues.
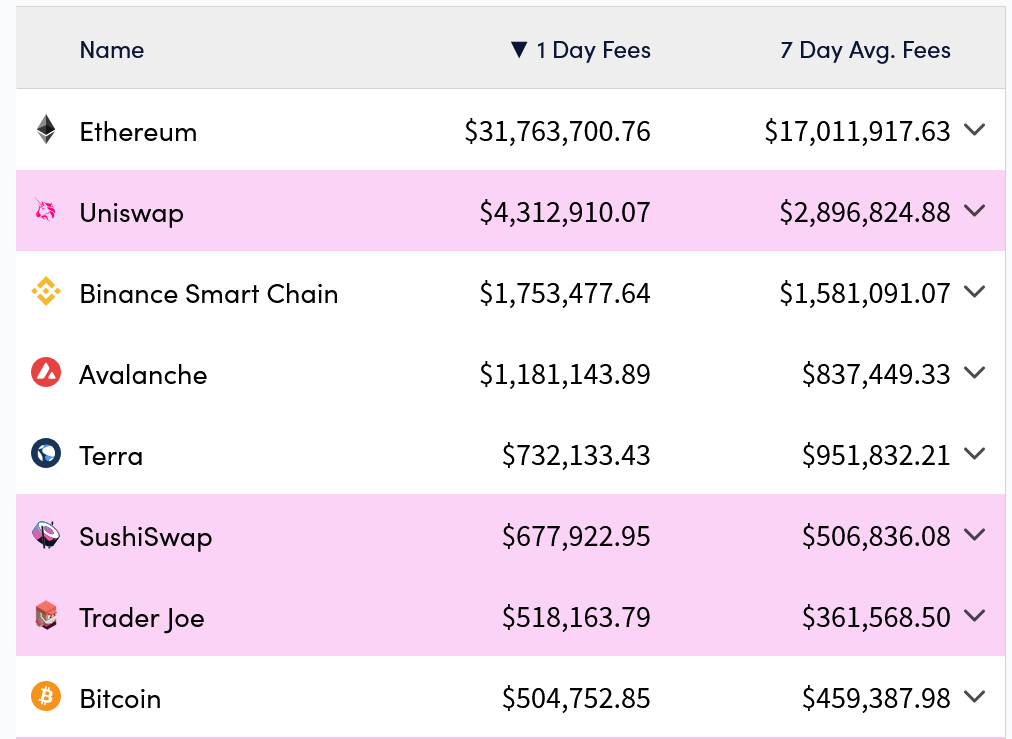
Fee revenue in relation to blockchains is calculated based on the gas fees paid to miners/stakers. On DeFi protocols it is calculated based on the trading fees or vault fees a protocol charges for it’s service.
In my opinion it’s a very good metric for assessing how much real value a protocol is delivering. If traders and yield farmers are willing to pay fees for a service then it’s adding value to justify it.
Token Appreciation
The vast majority of DeFi protocols offer a governance token. This is often distributed to users of the protocol to decentralise ownership and bootstrap early liquidity.
Token valuation can be measured in a number of ways.
- USD-Token this valuation can often be misleading because it may more clearly show how the wider crypto market is performing rather than individual protocol performance.
- ETH-Token a better metric for assessing performance relative to Ethereum or another L1 base asset. This will often highlight potential bad investments in terms of risk/reward relative to staked Ethereum.
- Market Cap – this USD based metric is calculated by multiplying the token price and the circulating supply (how many tokens are on the market). This is particularly useful for rebasing tokens like Ohm which accrue value outside of price appreciation.
